Charting market rotation, S&P 500 digests massive late-year rally
Focus: 10-year Treasury note yield extends downturn amid trend shift, Small- and mid-caps stage December breakouts
Technically speaking, the major U.S. benchmarks are acting well amid rotational late-year price action.
On a headline basis, the Dow industrials and Russell 2000 have staged early-December breakouts, while the S&P 500 and Nasdaq Composite tread water, working off previously overbought conditions. The charts below add color:
Editor’s Note: As always, updates can be directly accessed at https://chartingmarkets.substack.com.
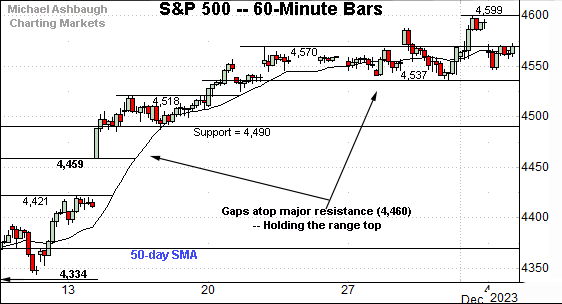
Before detailing the U.S. markets’ wider view, the S&P 500’s hourly chart highlights the past four weeks.
As illustrated, the S&P 500 has flatlined of late, digesting a steep November rally.
The sideways price action signals muted selling pressure, laying the groundwork for potential upside follow-through. When sellers are absent, prices rise to attract new sellers. (Or an adverse catalyst eventually emerges, inducing selling pressure.)
Tactically, the prevailing range bottom (4,537) roughly matches the S&P’s first support (4,540) detailed previously. Bullish price action.
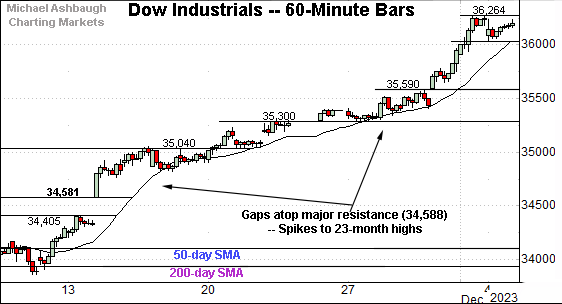
Meanwhile, the Dow Jones Industrial Average has diverged, extending a persistent rally.
The upturn has trended atop the 20-hour moving average — (almost precisely) — the earmarks of a powerful near-term trend.
Recent follow-through places the blue-chip benchmark at 23-month highs.
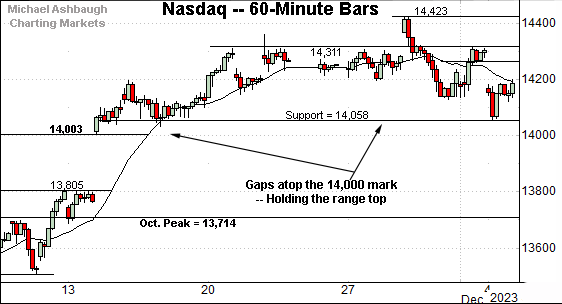
Against this backdrop, the Nasdaq Composite has flatlined in recent weeks, amid price action more closely resembling that of the S&P 500.
Tactically, the prevailing range bottom (14,058) is closely followed by gap support matching the 14,000 mark.
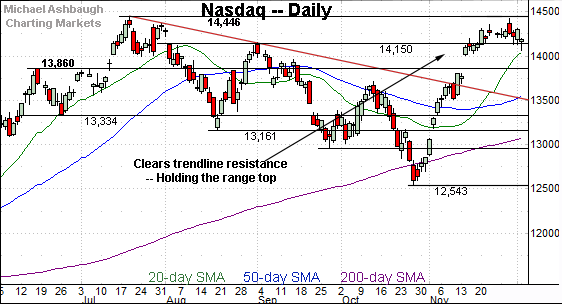
Widening the view to six months adds perspective.
On this wider view, the Nasdaq is digesting a steep November rally. Though the Nov. peak (14,423) registered slightly under resistance (14,446) the subsequent selling pressure near the range top has been muted.
Tactically, the breakout point (14,150) remains a notable floor, and is followed by deeper gap support (14,000). (Also see the hourly chart.)
Looking elsewhere, the Dow Jones Industrial Average has taken flight.
In the process, the index has tagged 23-month highs, its best level since Jan. 5, 2022.
Though near-term extended, and due to consolidate, the nearly straightline spike is longer-term bullish. Tactically, the breakout point (35,680) pivots to support.
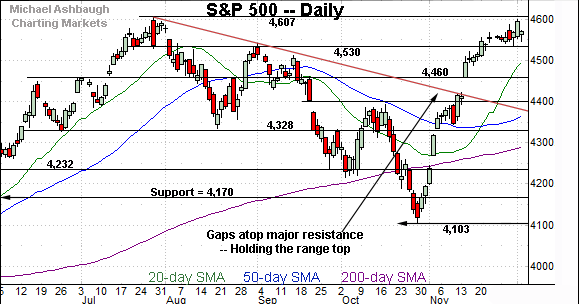
Against this backdrop, the S&P 500 has not yet cleared its range top.
The Dec. peak (4,599) has thus far registered slightly under resistance matching the 2023 peak (4,607).
Still, the relatively tight two-week range — hinged to the massive November spike — is technically constructive. Selling pressure remains limited despite material gains across just a few weeks.
The bigger picture
As detailed above, the major U.S. benchmarks are treading water, on balance, amid a still bullish bigger-picture backdrop.
The recent sideways price action — at least as it applies to the S&P 500 and Nasdaq Composite — punctuates a mid-November trend shift, detailed previously.
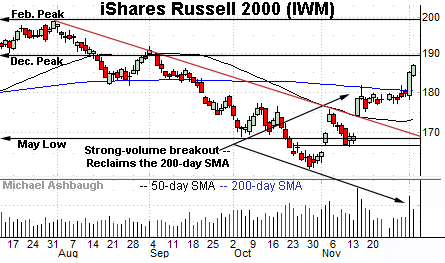
Moving to the small-caps, the iShares Russell 2000 ETF (IWM) has broken out.
Specifically, the small-cap benchmark has knifed atop its 200-day moving average, currently 180.34, rising amid a volume spike. Tactically, the 200-day closely matches the breakout point and pivots to support.
More broadly, the prevailing upturn builds on a November trendline breakout, also fueled by a volume spike.
Similarly, the SPDR S&P MidCap 400 ETF (MDY) is off to a strong December start.
Here again, the prevailing upturn builds on a mid-November trendline breakout.
Combined, the small- and mid-caps have confirmed their respective uptrends. (The Dow industrials have also staged a December breakout amid bullish rotational price action.)
Returning to the S&P 500, the index has asserted a flag-like pattern — the tight two-week range — hinged to the massive November spike.
Recall the steep rally encompassed a gap atop its trendline as well as major resistance (4,460) detailed repeatedly.
Also recall the mid-November gap — which signaled a trend shift — registered amid a rare 9-to-1 up day. (NYSE advancing volume surpassed declining volume by a 9-to-1 margin amid the gap atop the trendline.)
Fast forward to today, and the statistically unusual November spike has been punctuated by distinctly limited selling pressure. Bullish momentum is intact.
Against this backdrop, familiar support points remain in play.
To start, the S&P’s breakout point (4,540) — detailed Nov. 21 — remains first support. The prevailing two-week range bottom (4,537) has effectively matched support. (See the hourly chart.)
Delving deeper, familiar gap support (4,460) remains an inflection point. This area marked a technical level before the gap registered to match it. See for instance, the Aug. 29 review.
On further weakness, the 4,400-to-4,420 area is shaping up as a potentially notable floor, defined by the September and November gaps, while the 50-day moving average is rising within view.
As always, it’s not just what the markets do, it’s how they do it. But generally speaking, the S&P 500’s bigger-picture bias remains bullish barring a violation of the 4,400 area.
Watch List — 10-year Treasury note yield consolidates amid trend shift
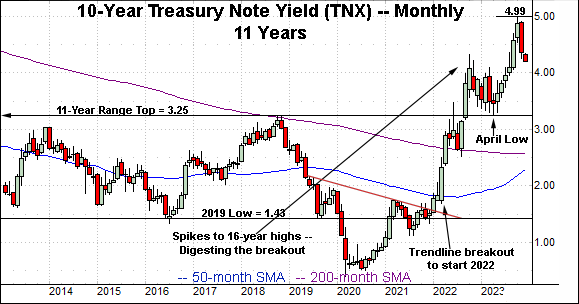
Concluding on a stray note, the 10-year Treasury note yield (TNX) has turned lower, contributing to — if not outright fueling — the broad-market November rally.
Consider that the major U.S. benchmarks’ massive mid-November breakouts coincided with the yield’s trendline violation. (The S&P 500 gapped atop 4,460 as the yield violated its trendline etc.)
Perhaps more notably, the yield has subsequently followed through lower, violating the 4.34 area, matching the 2008 and 2022 peaks. This remains an important bull-bear fulcrum. (Also see the Oct. 25 review and Sept. 27 review.)
Combine the trendline violation with material downside follow-through and the yield’s intermediate-term bias points sideways to lower. A swift reversal back atop the 4.34 area would raise a technical question mark.
(On a granular note, the 50-day moving average’s slope has turned lower, also consistent with a trend shift.)
Also see Nov. 8: Charting a bullish reversal, Nasdaq challenges key trendline.
Also see Nov. 21: Charting a primary trend shift, S&P 500 clears key trendline amid 9-to-1 up day.


