Charting a bullish reversal, Nasdaq challenges key trendline
Focus: Small- and mid-cap benchmarks capped by 50-day average
Technically speaking, the major U.S. benchmarks have rallied sharply to start November and the best six months seasonally.
Against this backdrop, the S&P 500 and Nasdaq Composite have knifed within striking distance of important trendlines. The pending selling pressure near resistance, or lack thereof, will likely add color.
Editor’s Note: As always, updates can be directly accessed at https://chartingmarkets.substack.com.
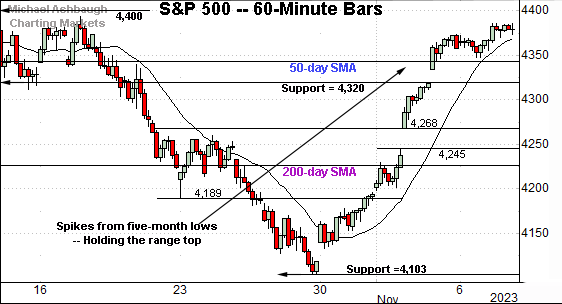
Before detailing the U.S. markets’ wider view, the S&P 500’s hourly chart highlights the past four weeks.
As illustrated, the S&P 500 has spiked from five-month lows, rising after the Federal Reserve’s dovish-leaning policy statement. Easing inflation data, and perhaps geopolitical tensions, have contributed to the less-hawkish tone.
Against this backdrop, the S&P has knifed to its range top, thus far sustaining a break back atop the 50-day moving average, currently 4,343.
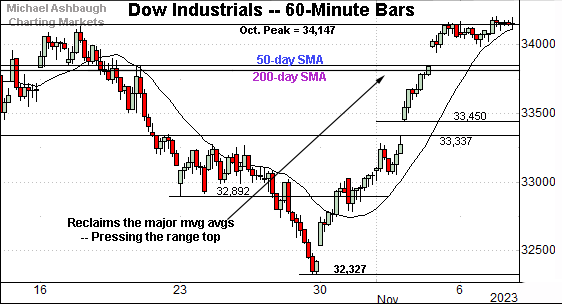
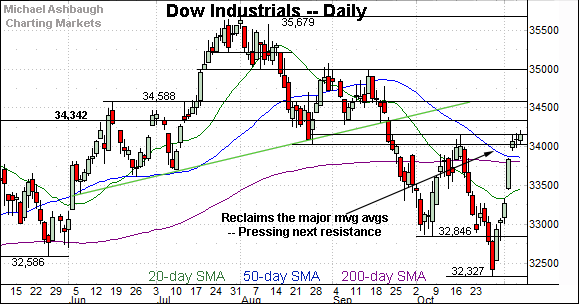
Meanwhile, the Dow Jones Industrial Average has also knifed to its range top.
The strong November start places it back atop the 50- and 200-day moving averages, areas also detailed on the daily chart.
From current levels, the October peak (34,147) remains an overhead hurdle, detailed previously. The early-November closing high (34,152) has registered nearby.
The pending selling pressure in this area, or lack thereof, may be a useful bull-bear gauge. (A swift reversal back under the major moving averages would raise a technical question mark.)
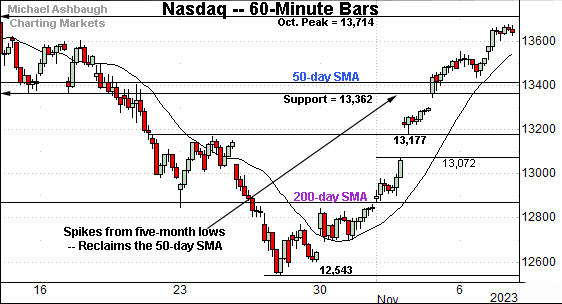
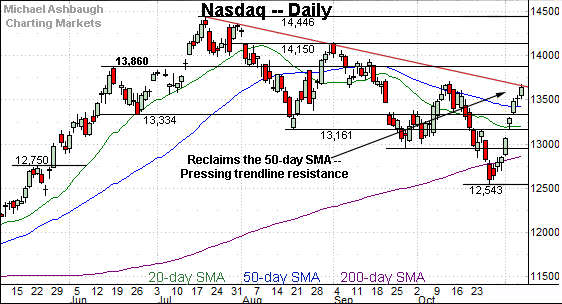
Against this backdrop, the Nasdaq Composite has rallied from five-month lows.
The prevailing upturn places it back atop the 50-day moving average, currently 13,414.
Still, major resistance rests just overhead, areas better detailed on the daily chart below.
Combined, each big three U.S. benchmark has knifed from its range bottom, reclaiming several widely-tracked technical levels. Market bears are not dictating the technical tone (for a change) to start November.
Widening the view to six months adds perspective.
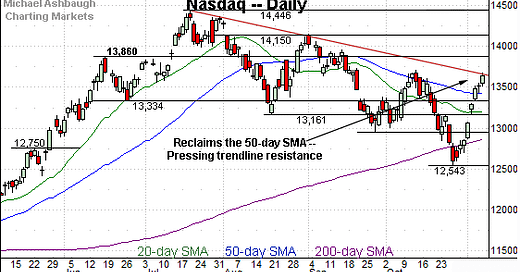
On this wider view, the Nasdaq has reached an important technical test. The prevailing upturn places two key technical levels under siege:
Trendline resistance, currently in the 13,680 area.
The October peak (13,714).
Against this backdrop, upside follow-through would place the Nasdaq atop its downtrend, while also marking a “higher high” versus the October peak. Both events would signal a bullish trend shift.
Combined, the response to the 13,680-to-13,715 area is worth tracking. As always, the chances of a breakout improve to the extent an index holds relatively tightly to resistance.
Looking elsewhere, the Dow Jones Industrial Average has knifed from seven-month lows.
The November spike places it back atop two headline technical levels:
The 50-day moving average, currently 33,850.
The 200-day moving average, currently 33,812.
To reiterate, a swift reveral back under the major moving averages would raise a technical question mark. This area “should” draw buyers if a bullish trend shift is underway.
More immediately, the prevailing upturn places the October peak (34,147) in play. The early-November closing high (34,152) has effectively matched resistance.
Tactically, sustained follow-through atop this area would mark a “higher high” strengthening the bull case.
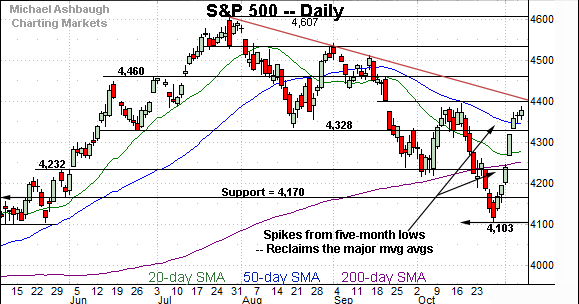
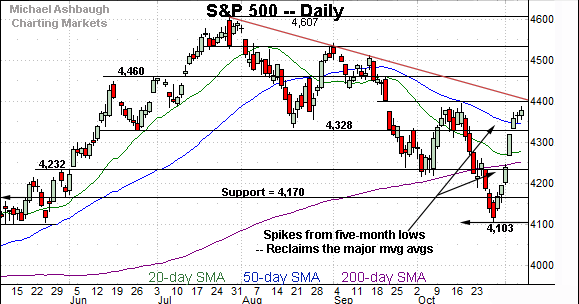
Against this backdrop, the S&P 500 has rallied from five-month lows, reclaiming its 50- and 200-day moving averages across just two sessions.
The sharp upturn places three levels within view:
Gap resistance (4,401) matching the top of the September gap.
The October peak (4,393).
Trendline resistance, descending toward the 4,400 mark.
The pending selling pressure in this area, or lack thereof, will likely be a useful bull-bear gauge.
The bigger picture
As detailed above, the major U.S. benchmarks have reversed sharply from the October low. In the process:
The S&P 500 has rallied as much as 288 points, or 7.0%, across just nine sessions.
The Nasdaq Composite has spiked as much as 1,141 points or 9.1%, across 10 sessions.
The Dow Jones Industrial Average has gained 2,198 points, or 6.8%, across nine sessions.
This marks a strong start to November and the markets’ best six months seasonally — November through May. (This bullish six-month phase is statistically significant, and a global phenomenon, registering beyond U.S. markets.)
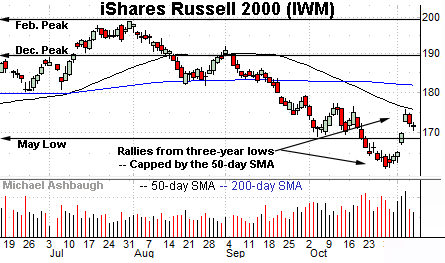
Moving to the small-caps, the iShares Russell 2000 ETF (IWM) has reversed from three-year lows.
Specifically, the small-cap benchmark is rising from its lowest level since Nov. 4, 2020, established amid the pandemic era, and just days before the U.S. election.
More immediately, the strong-volume November spike has been capped by the 50-day moving average, currently 175.30. Still, the initial pullback from this area has been comparably flat, fueled by decreased volume.
Tactically, the recovery attempt gets the benefit of the doubt barring a violation of the May low — the 167.50 area. (But note the 50-day moving average has marked a useful intermediate-term trending indicator.)
Meanwhile, the SPDR S&P MidCap 400 ETF (MDY) has rallied from 52-week lows.
Here again, the early-November spike has been capped by the 50-day moving average, currently 454.30. Sustained follow-through atop this area would strengthen the bull case.
Conversely, the May low — the 437.50 area — pivots to support.
Returning to the S&P 500, the index has staged its sharpest rally since June: A nine-session spike, spanning as much as 288 points, or 7.0%.
In the process, the S&P has reclaimed several technical levels, signaling a change in market structure. If bearish momentum were intact, the 4,230 or 4,330 areas would have been expected to draw selling pressure.
But even amid recent strength, the S&P 500 has not definitively signaled a true trend shift. Three important technical levels rest just overhead:
Gap resistance (4,401) matching the top of the September gap.
The October peak (4,393).
Trendline resistance, descending toward the 4,400 mark.
Against this backdrop, follow-through atop this area — the 4,390-to-4,400 area — would place the S&P atop its atop its downtrend, while also marking a “higher high” versus the October peak. Both events would more definitively signal a bullish trend shift.
So tactically, the pending selling pressure near the 4,400 mark is worth tracking. The chances of an eventual breakout improve to the extent the S&P holds tightly to resistance.
Conversely, the 4,320-to-4,330 area pivots to notable support. An eventual violation would ostensibly punctuate a failed trendline test, raising a technical question mark.
Combined, the S&P 500’s November rally attempt gets the benefit of the doubt — based on today’s backdrop — though the response to the areas detailed may strengthen the bull or bear case respectively.

