


Charting a bull-bear battle, S&P 500 challenges the breakdown point (4,460)
Focus: Russell 2000 survives test of 200-day average, Nasdaq vies to neutralize head-and-shoulders top

Technically speaking, the major U.S. benchmarks are vying to rally in the wake of a respectable summer downturn.
Against this backdrop, the S&P 500 and Nasdaq Composite are challenging their 50-day moving averages, levels matching important bull-bear inflection points. The S&P 4,460 and Nasdaq 13,860 areas are worth tracking.
Editor’s Note: As always, updates can be directly accessed at https://chartingmarkets.substack.com.
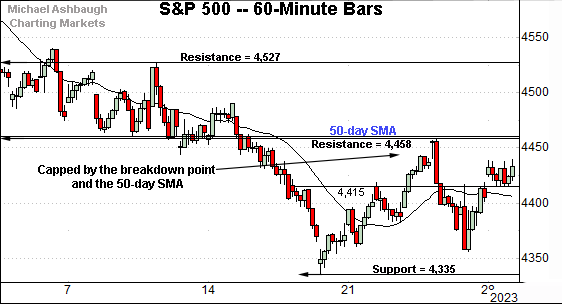
Before detailing the U.S. markets’ wider view, the S&P 500’s hourly chart highlights the past four weeks.
As illustrated, the S&P 500 is traversing a lower plateau.
Tactically, major resistance (4,458) closely matches the 50-day moving average, currently 4,460.
This area remains an intermediate-term inflection point, detailed previously. (See the Aug. 17 review.) Last week’s high (4,458) matched resistance, and at least modest selling pressure surfaced.
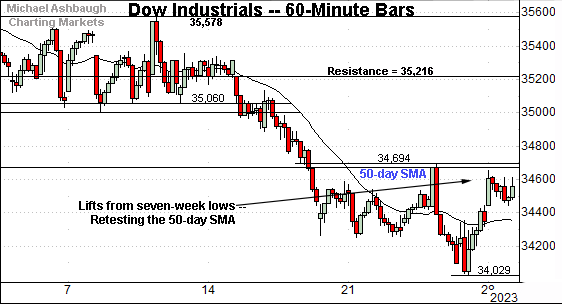
Similarly, the Dow Jones Industrial Average is holding its range bottom.
Here again, the 50-day moving average, currently 34,674, effectively defines the two-week range top. Tactically, upside follow-through atop this area would strengthen the bull case.
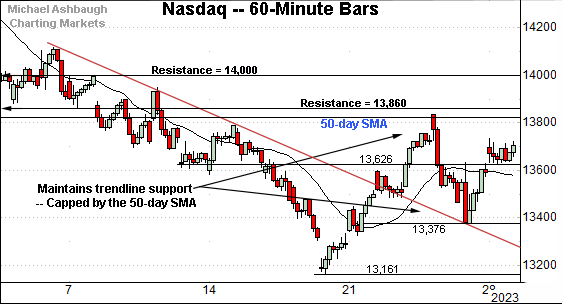
Against this backdrop, the Nasdaq Composite is crammed between two technical levels.
To start, the index has maintained trendline support amid a thus far lukewarm recovery attempt.
Conversely, the index remains capped by its 50-day moving average, currently 13,815, an area roughly matching major resistance (13,860). (Also see the daily chart.)
More broadly, the Nasdaq and S&P 500 are rising from a “higher low” at the late-August low, unlike the Dow industrials. This marks a rotation back toward growth (technology stocks) and away from value (dividend-yielding stocks) for the very near-term.
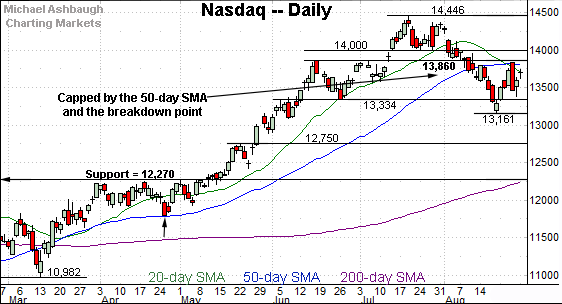
Widening the view to six months adds perspective.
On this wider view, the Nasdaq has pulled in to a lower plateau.
To reiterate, the late-August range has been capped by the 50-day moving average, currently 13,815, an area roughly matching the breakdown point (13,860).
More broadly, market bears will point to a developing head-and-shoulders top defined by the June, July and late-August peaks. This is a high-reliability bearish reversal pattern.
Tactically, sustained follow-through atop the 13,860 area would neutralize the bearish setup. This area defines the Nasdaq’s intermediate-term bias, based on today’s backdrop.
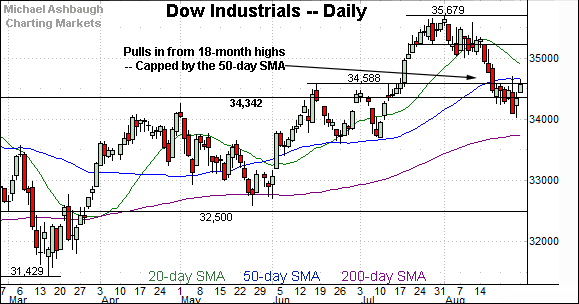
Looking elsewhere, the Dow Jones Industrial Average is hugging its breakout point.
Against this backdrop, the recent upturn has at least initially been capped by the 50-day moving average, currently 34,674.
Tactically, the 50-day moving average has marked a summer inflection point, formerly underpinning the June and July lows.
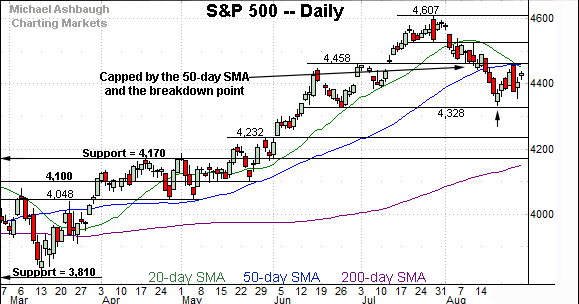
Meanwhile, the S&P 500 has also staged an August downturn.
Tactically, the prevailing range is capped by the breakdown point (4,458) a level closely matching the 50-day moving average, currently 4,460.
Conversely, the 4,330 area — detailed previously — has underpinned the prevailing range.
And here again, market bears might point to a developing head-and-shoulders top. (The range spanning from about 4,330 to 4,460 defines the left and right shoulders.)
The bigger picture
As detailed above, the major U.S. benchmarks are digesting a respectable August downturn.
Amid the pullback, each index has violated its 50-day moving average, areas that have subsequently capped the initial rally attempt. The ongoing retest of each area will be a useful bull-bear gauge.
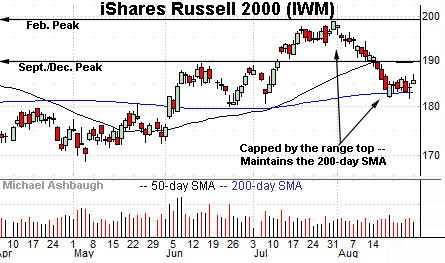
Moving to the small-caps, the iShares Russell 2000 ETF (IWM) has survived an important technical test.
Specifically, the small-cap benchmark has maintained its 200-day moving average, currently 183.00. The prevailing upturn — though admittedly modest — punctuates a prolonged six-session retest. The pending upside follow-through, or lack thereof, should add color.
As always, the 200-day is a widely-tracked longer-term trending indicator. Recall the successful June retest.
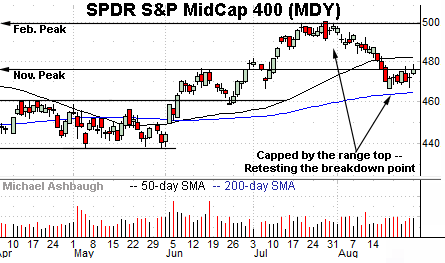
Similarly, the SPDR S&P MidCap 400 ETF (MDY) has maintained its 200-day moving average. The mid-August low registered slightly above the 200-day.
More immediately, the mid-cap benchmark is retesting its breakdown point, circa 475.
Combined, the small- and mid-cap benchmarks have pulled in from their range top — areas matching the Feb. peaks — to a thus far successful test of the 200-day moving average. The longer-term trends remains bullish, based on today’s backdrop.

Returning to the S&P 500, the index is traversing a lower plateau. (Though it remains firmly above its 200-day moving average (in purple), outpacing the small- and mid-cap benchmarks.)
Recall the prevailing pullback punctuates an eight-week 10.5% rally to the July peak.
By comparison, the subsequent downturn spanned as much as 5.9% across just three weeks. So on its face, the August pullback may be sufficient for the bullish broader market trends to resume.
Against this backdrop, the 4,460 area — detailed previously — remains an intermediate-term bull-bear fulcrum. Sustained upside follow-through atop this area would signal a bullish intermediate-term bias.
Conversely, a failed retest of the 4,460 area from underneath preserves a developing head-and-shoulders top defined by the June, July and late-August peaks.
In this case, the 4,328-to-4,335 area defines the pattern’s neckline, and marks important support. An eventual violation would mark a material “lower low” opening the path to potentially aggressive downside follow-through.
As always, it’s not just what the markets do, it’s how they do it. But broadly speaking, the pending retest of the S&P 4,460 area will contribute to the intermediate-term technical tone. (Similarly, the Nasdaq’s response to the 13,860 area is worth tracking.)
Beyond near-term issues, the major benchmarks’ bigger-picture backdrop remains bullish.
Also see Aug. 17: Charting market cross currents, S&P 500 violates 50-day average.