Charting a primary trend shift, S&P 500 clears key trendline amid 9-to-1 up day
Focus: Small- and mid-caps spike amid surging market breadth
Technically speaking, the major U.S. benchmarks have signaled a trend shift, building on an early-November bullish reversal.
In the process, the S&P 500 and Nasdaq Composite have cleared several key technical levels, rising amid statistically unusual bullish momentum in spots. The charts below add color:
Editor’s Note: As always, updates can be directly accessed at https://chartingmarkets.substack.com.
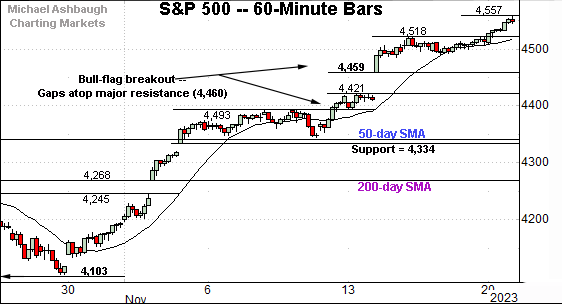
Before detailing the U.S. markets’ wider view, the S&P 500’s hourly chart highlights the past four weeks.
As illustrated, the S&P 500 has staged a steep November rally. From the Oct. low to the Nov. peak, the rally has spanned as much as 454 points, or 11.1%.
Tactically, the prevailing upturn has been punctuated by a gap atop major resistance (4,460), a level also detailed on the daily chart. This area pivots to notable support.
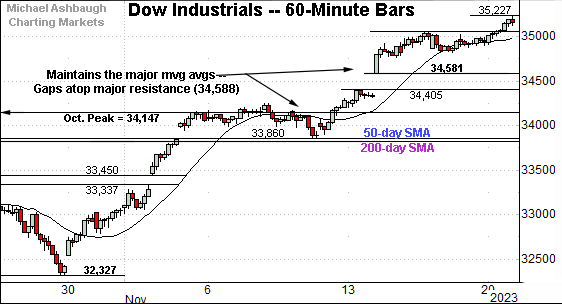
Similarly, the Dow Jones Industrial Average has staged a persisent November rally.
From bottom to top, the upturn spans as much as 2,900 points, or 9.0%.
Here again, recent strength has been punctuated by a gap atop major resistance (34,588), a level also detailed on the daily chart.
Slightly more broadly, the mid-month upturn orignates from a successful test of the 50- and 200-day moving averages. Bullish price action.
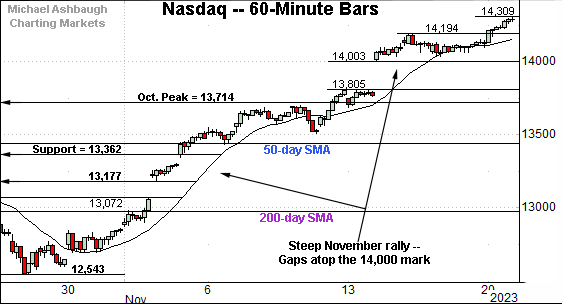
Against this backdrop, the Nasdaq Composite has staged the steepest November spike.
From the Oct. low to the Nov. peak, the rally has spanned as much as 1,766 points, or 14.1%.
Tactically, the upturn has encompassed a recent gap atop the 14,000 mark.
Combined, each big three U.S. benchmark has powered through several widely-tracked technical levels, price action consistent with a material trend shift.
Widening the view to six months adds perspective.
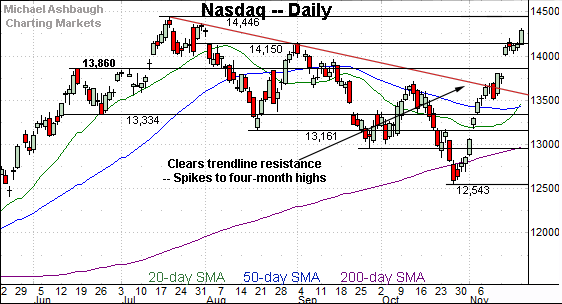
On this wider view, the Nasdaq has extended a mid-month spike atop trendline resistance, an area detailed previously. The prevailing upturn places the index at four-month highs.
Tactically, the breakout point (14,150) is closely followed by gap support matching the 14,000 mark. (Also see the hourly chart.)
More broadly, the Nasdaq’s backdrop supports a bullish bias barring an eventual violation of trendline support.
Looking elsewhere, the Dow Jones Industrial Average has knifed from the October low to three-month highs.
Tactically, the mid-November follow-through has been punctuated by a gap atop major resistance (34,588) detailed previously. The top of the gap (34,581) registered nearby.
Slightly more broadly, the mid-month spike originates from a successful test of the 50- and 200-day moving averages. Recall this area marks an important bull-bear fulcrum.
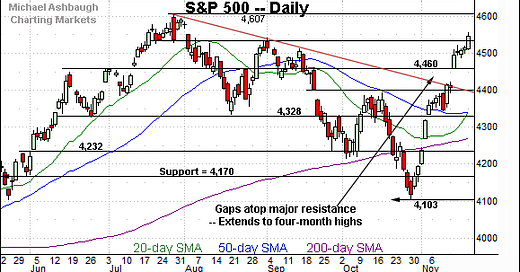
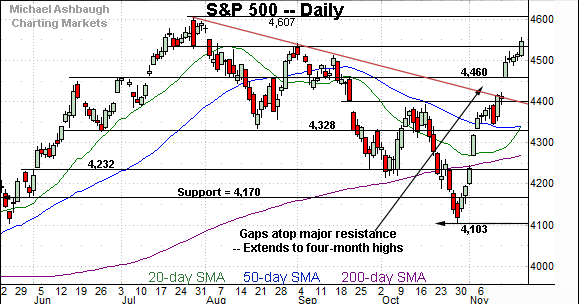
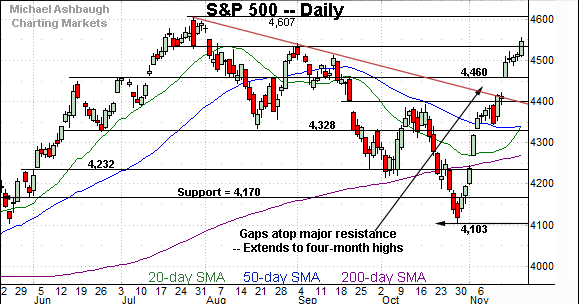
Against this backdrop, the S&P 500 has tagged four-month highs.
Tactically, the steep rally has encompassed a gap atop major resistance (4,460) detailed previously. Here again, the top of the gap (4,459) registered nearby.
Moreover, the gap atop resistance marked a rare 9-to-1 up day detailed in the next section.
The bigger picture
As detailed above, the major U.S. benchmarks have signaled a trend shift, building on the early-November bullish reversal.
In the process, each big three U.S. benchmark has tagged multi-month highs, placing distance firmly atop key trendlines.
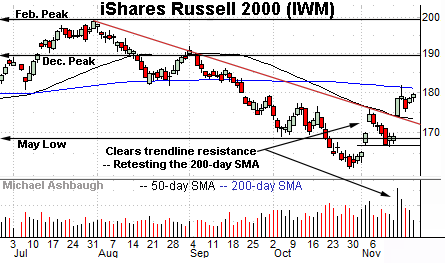
Moving to the small-caps, the iShares Russell 2000 ETF (IWM) has also come to life technically.
Specifically, the small-cap benchmark has gapped atop trendline resistance, rising amid a volume spike.
The aggressive rally places the 200-day moving average, currently 180.94, just overhead. Conversely, the top of the gap (174.22) pivots to support, an area closely matching the 50-day moving average.
More broadly, the prevailing upturn originates from the lowest level since Nov. 4, 2020, established amid the pandemic era, and just before the U.S. election.
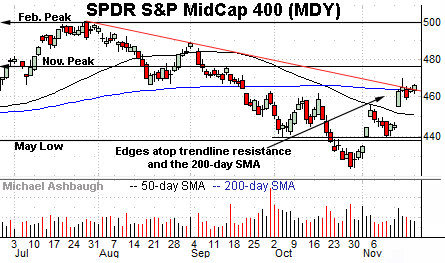
Meanwhile, the SPDR S&P MidCap 400 ETF (MDY) has reached a headline technical test.
Specifically, the mid-cap benchmark is challenging trendline resistance closely matching the 200-day moving average, currently 463.00.
Tactically, the selling pressure in this area, or lack thereof, should be a useful bull-bear gauge. (The initially muted selling pressure near resistance, and modest follow-through, is technically bullish.)
Combined, the small- and mid-caps’ resurgence signals improved market breadth, strengthening the bull case.
Returning to the S&P 500, the index has staged a directionally sharp November spike.
The massive rally encompasses a gap atop its trendline as well as major resistance (4,460) detailed repeatedly.
To reiterate, the top of the gap (4,459) effectively matched the 4,460 mark.
Against this backdrop, the mid-November gap — which signaled a trend shift — registered unusually strong bullish momentum in the form of a 9-to-1 up day. (NYSE advancing volume surpassed declining volume by a 9-to-1 margin amid the gap atop the trendline.)
Combine this with other breadth signals reaching bullish extremes not registered in decades, and a durable market rally looks likely.
To be sure, the S&P 500 is now near-term extended following a three-week 11.1% run. A cooling-off period, or sideways chopping around phase, is overdue. Even a modest pullback would not be unexpected.
But the important point is the directionally steep November rally, encompassing a pivotal 9-to-1 up day, has knifed atop all kinds of technical levels. So the S&P’s intermediate- to longer-term bias is firmly-bullish based on today’s backdrop.
From current levels, the S&P’s breakout point (4,540) pivots to first support and is followed by familiar gap support (4,460). A swift reversal back under the 4,460 area would raise a technical question mark.
Delving deeper, the 4,390-to-4,400 area matches the S&P’s former trendline.
As always, it’s not just what the markets do, it’s how they do it. But generally speaking, the S&P 500’s bigger-picture bias remains bullish barring a violation of the 4,390 area.
Also see Nov. 8: Charting a bullish reversal, Nasdaq challenges key trendline.
Also see Sept. 27: Charting a bearish technical tilt, S&P 500 sells off from major resistance (4,460).
Also see Sept. 13: Charting a bull-bear stalemate, S&P 500 asserts range hinged to key level (4,460).

