Charting another bearish technical tilt, S&P 500 ventures under 200-day average
Focus: 10-year Treasury note yield extends massive multi-year breakout
Technically speaking, the major U.S. benchmarks’ bigger-picture backdrop remains bearish-leaning.
On a headline basis, the S&P 500 and Nasdaq Composite have recently confirmed intermediate-term downtrends, pressured amid still-surging U.S. Treasury yields.
Against this backdrop, the S&P 500 has reached a more important test of its 200-day moving average, a level that’s firmly under siege. The response to this area — potentially across the next several sessions — will likely set the broad-market technical tone.
Editor’s Note: As always, updates can be directly accessed at https://chartingmarkets.substack.com.
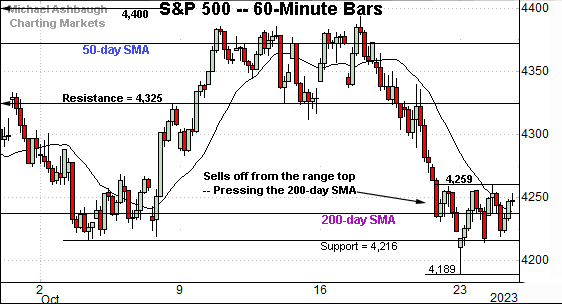
Before detailing the U.S. markets’ wider view, the S&P 500’s hourly chart highlights the past four weeks.
As illustrated, the S&P 500 has reached a headline technical test.
Specifically, the index is challenging its 200-day moving average, currently 4,238, a widely-tracked longer-term trending indicator. The sluggish rally from this area, thus far, lays the groundwork for potential downside follow-through.
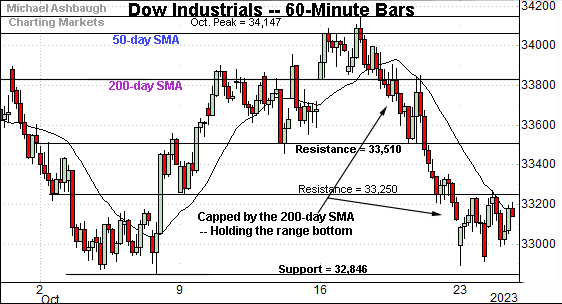
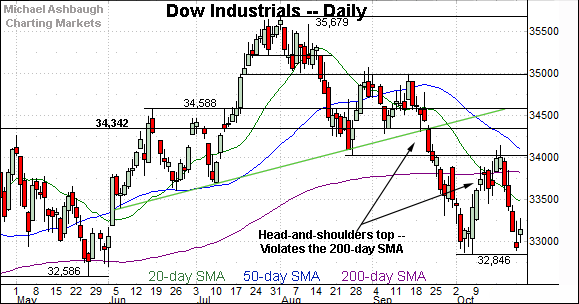
Meanwhile, the Dow Jones Industrial Average has placed distance under its 200-day moving average.
And here again, the index is holding its range bottom, capped by resistance (33,250) amid a thus far sluggish rally attempt. Bearish price action.
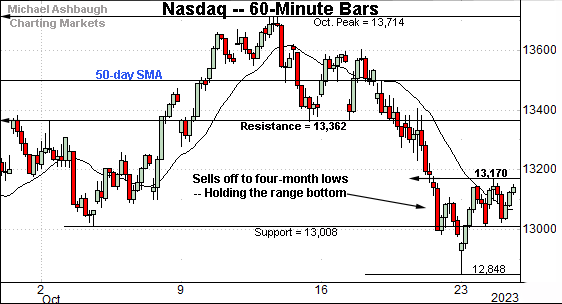
Against this backdrop, the Nasdaq Composite has tagged four-month lows.
Notably, the recent rally attempt has been capped by resistance — the 13,160-to-13,170 area — also detailed on the daily chart below. Shaky price action.
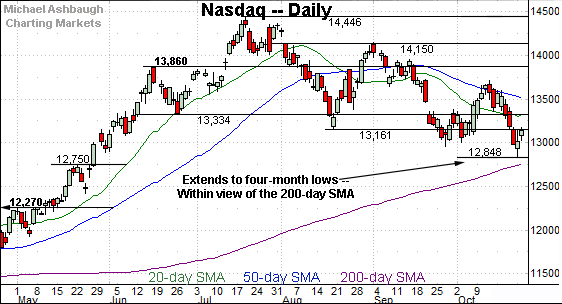
Widening the view to six months adds perspective.
On this wider view, the Nasdaq’s intermediate-term bias remains bearish. (See the Oct. 11 review.)
To start, the index has asserted a posture under its 50-day moving average, a widely-tracked intermediate-term trending indicator.
Separately, the Nasdaq continues to register “lower highs” and “lower lows” consistent with a downtrend.
On further weakness, the marquee 200-day moving average, currently 12,767, is increasingly within striking distance. An eventual violation would raise a technical red flag.
Looking elsewhere, the Dow industrials’ longer-term bias remains bearish.
To start, the index has knifed aggressively under its 200-day moving average for the second time across as many months.
The latest leg lower punctuates a failed test of the breakdown point — the 34,000 area — roughly matching the August low.
More broadly, recent weakness builds on a head-and-shoulders top defined by the June, August and September peaks. Bearish price action. (Also see the Oct. 11 review.)
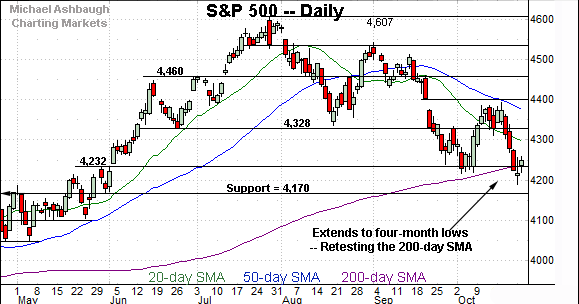
Against this backdrop, the S&P 500 has reached a headline technical test.
To reiterate, the index has whipsawed at its 200-day moving average, currently 4,238, a widely-tracked longer-term trending indicator. The quality of the rally from this area — which thus far gets low marks for style — should be a useful bull-bear gauge.
Slightly more broadly, the S&P’s prevailing downturn punctuates a failed test of gap resistance (4,400) an area then matching the 50-day moving average.
(On a granular note, the 200-day moving average, currently 4,238, also matches major support (4,232) detailed previously. The sluggish rally from this area raises a question mark.)
The bigger picture
As detailed above, the U.S. benchmarks’ bigger-picture backdrop remains bearish-leaning.
On a headline basis, the S&P 500 and Nasdaq Composite have recently confirmed intermediate-term downtrends — notching a “lower low” — and placing distance under the 50-day moving average.
Against this backdrop, the S&P 500 has reached a more important test of its 200-day moving average, currently 4,238, an area that’s firmly under siege.
The response to the S&P’s 200-day — potentially across the next several sessions — will likely set the broad-market technical tone.
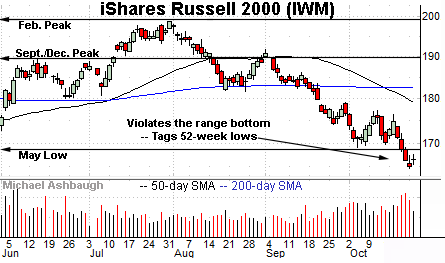
Moving to the small-caps, the iShares Russell 2000 ETF (IWM) has tagged 52-week lows.
As illustrated, the initial strong-volume downdraft has been punctuated by a comparably sluggish rally attempt.
Tactically, the breakdown point (168.40) pivots to resistance. A swift reversal higher would place the brakes on bearish momentum.
More broadly, recall the September downturn punctuated a head-and-shoulders top defined by the June, July and September peaks. The 200-day moving average roughly tracked the pattern’s neckline.
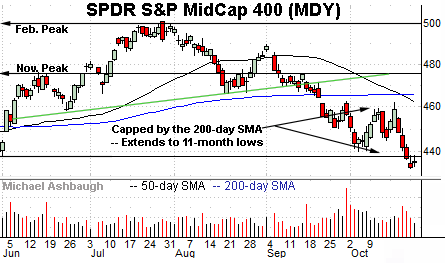
Meanwhile, the SPDR S&P MidCap 400 ETF (MDY) has tagged 11-month lows.
Here again, the strong-volume downdraft has been punctuated by a comparably sluggish rally attempt.
Tactically, the 437.50 area pivots to resistance. The pending retest from underneath may add color.
Returning to the S&P 500, the index is teetering near a headline inflection point.
The specific area — the 4,232-to-4,238 area, detailed previously — matches major support and the 200-day moving average.
Against this backdrop, the early-October rally from support — from the 4,232 area — stalled near gap resistance (4,400) then matching the 50-day moving average.
The subsequent downturn, still underway, has been punctuated by a “lower low” and an extended test of the 200-day moving average. Bearish price action.
On further weakness, the 4,170 area marks major support, a level going back to the mid-2021 lows. (This could be pegged as last-ditch support for those with a bullish bias/outlook, which is not the view here.)
So collectively, the S&P 500’s bearish intermediate-term bias is firmly intact.
Meanwhile, the S&P 500’s more important longer-term bias is in flux amid a bull-bear battle near the 200-day moving average. The response to this area — potentially across the next several sessions — will likely set the broad-market tone.
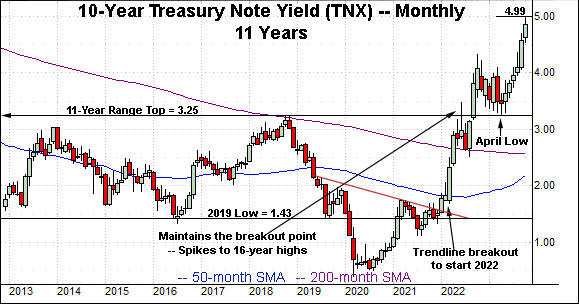
Watch List — 10-year Treasury note yield extends multi-year breakout
Concluding on a stray note, the 10-year Treasury note yield (TNX) has extended an aggressive late-year breakout.
In the process, the yield has tagged 16-year highs, its highest level since July 2007.
Tactically, a longer-term yield target continues to project to the 5.40 area. (The prior range spanned from the October 2022 peak (4.33) to the April 2023 low (3.25), a level precisely matching the yield’s breakout point at the 2018 peak (3.25). See the Sept. 27 review.)
More broadly, the prevailing rate of change remains a market headwind. The yield has spiked as much as 94 basis points from the September low, or nearly a full percentage point (from 4.0 to 5.0) across about eight weeks.
Also see Oct. 11: Charting a corrective bounce, S&P 500 vies to extend rally from major support (4,230).
Also see Sept. 27: Charting a bearish technical tilt, S&P 500 sells off from major resistance (4,460).


