Charting a bearish technical tilt, S&P 500 sells off from major resistance (4,460)
Focus: Dow industrials violate 200-day average, 10-year Treasury yield tags highest level since 2007
Technically speaking, the major U.S. benchmarks have staged a shaky, if not outright bearish, technical turn as the third-quarter close approaches.
On a headline basis, the S&P 500 and Nasdaq Composite have tagged multi-month lows — amid directionally sharp downdrafts — while the Dow Jones Industrial Average has violated its marquee 200-day moving average.
Editor’s Note: As always, updates can be directly accessed at https://chartingmarkets.substack.com.
Before detailing the U.S. markets’ wider view, the S&P 500’s hourly chart highlights the past four weeks.
As illustrated, the S&P 500 has staged a late-September downdraft, tagging three-month lows.
The prevailing downturn originates from major resistance — the 4,460 area — detailed repeatedly.
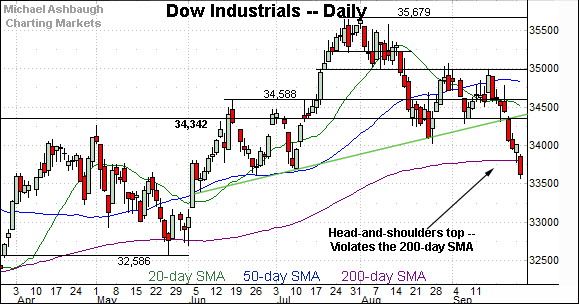
Meanwhile, the Dow Jones Industrial Average has registered a headline technical event.
Specifically, the Dow has violated its 200-day moving average, currently 33,808, a widely-tracked longer-term trending indicator. The aggressive downturn is also detailed on the daily chart.
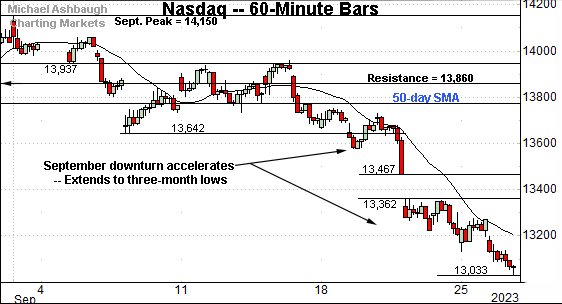
Against this backdrop, the Nasdaq Composite has also turned lower.
Like the S&P 500, the Nasdaq’s downdraft encompasses a respectable gap lower amid a delayed reaction, of sorts, to the Federal Reserve’s hawkish-leaning policy directive. (The gap registered the day after the policy statement.)
Tactically, the 13,360 area pivots to notable resistance tied to event-driven price action.
Widening the view to six months adds perspective.
On this wider view, the Nasdaq has staged a steady September downturn, tagging nearly four-month lows. The prevailing downturn opens the path to a less-charted patch, encompassing the steep May-through-June rally.
Put differently, the Nasdaq is tenuously positioned, traversing less-charted territory, punctuated by not so well-defined support.
Tactically, the 13,335-to-13,360 area pivots to notable resistance. A swift reversal higher would place the brakes on bearish momentum. (Also see the hourly chart.)
Conversely, the 12,750 area marks potential support and is followed by the marquee 200-day moving average, currently 12,500. An eventual retest is a real prospect.
Looking elsewhere, the Dow Jones Industrial Average has staged a headline technical event.
Specifically, the index has violated its 200-day moving average, knifing lower on the first approach. Ominous price action.
As always, the 200-day is a widely-tracked longer-term trending indicator. Within a primary uptrend, this area would be expected to draw buyers on the first retest. (See the May low.)
Tactically, the pending retest of the 200-day moving average from underneath — currently the 33,800 area — should be a useful bull-bear gauge.
Meanwhile, the S&P 500 has also tagged nearly four-month lows.
To reiterate, the prevailing downturn originates from major resistance — the 4,460 area — detailed repeatedly.
From current levels, the breakdown point — the 4,330 area — pivots to notable overhead.
The bigger picture
As detailed above, the major U.S. benchmarks have registered bearish late-September price action, as the third-quarter close approaches.
On a headline basis, the S&P 500 and Nasdaq Composite have tagged nearly four-month lows, pressured amid a directionally-sharp September downdraft. Recent intervening rally attempts have been shallow and short-lived.
Meanwhile, the Dow Jones Industrial Average has violated its marquee 200-day moving average, pressured to punctuate a head-and-shoulders top, detailed on the daily chart.
And perhaps as notably, market breadth has pressed bearish extremes amid the downturn. For instance, the prevailing downturn has been punctuated by a 7-to-1 NYSE down day as the major benchmarks tag new lows. (Declining volume surpassed advancing volume by an aggressive 7-to-1 margin.)
Moving to the small-caps, the iShares Russell 2000 ETF (IWM) has registered nearly four-month lows.
The prevailing downturn punctuates a head-and-shoulders top defined by the June, July and September peaks. Recall the 200-day moving average (in blue) roughly tracks the pattern’s neckline. (See the Sept. 13 review.)
As always, the 200-day is a widely-tracked longer-term trending indicator. So the decisive strong-volume violation of this area raises a technical red flag.
Tactically, an eventual reversal back atop the breakdown point and the 200-day moving average — the 182-to-183 area — would place the small-cap benchmark on firmer ground.
Similarly, the SPDR S&P MidCap 400 ETF (MDY) has reached nearly four-month lows, pressured amid increased volume.
Here again, the downdraft punctuates a head-and-shoulders top, as well as a violation of the 200-day moving average. Bearish price action.
Tactically, a swift reversal atop gap resistance and the 200-day moving average — the 461.50-to-465.50 area — would place the brakes on bearish momentum. Such a move looks unlikely based on today’s backdrop. (Also see the Sept. 13 review.)
Returning to the S&P 500, the index has reached a less-charted patch to conclude the third quarter.
Tactically, the breakdown point — the 4,330 area — marks notable resistance. A swift reversal atop this area would place the brakes on bearish momentum. The pending retest from underneath will likely add color.
Conversely, the S&P’s 200-day moving average, currently 4,196, is increasingly within view. An eventual retest cannot be ruled out amid the September downdraft’s aggressiveness.
Delving slightly deeper, the 4,170 area marks major support, an area going back to the mid-2021 lows.
So collectively, a bearish intermediate-term bias has registered to conclude the third quarter. The widely-tracked benchmarks have violated important technical levels amid aggressive selling pressure in spots.
Meanwhile, the S&P 500’s longer-term bias remains bullish — based on today’s backdrop — though a potentially swift test of the 200-day moving average marks a “watch out.” (See the Dow industrials’ backdrop.) The turn-of-the-month price action may add color.
Watch List — 10-year Treasury note yield takes flight
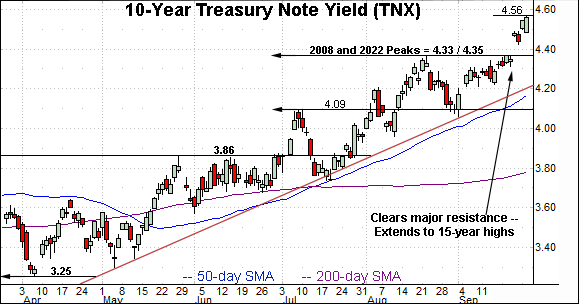
Concluding on a stray note, the 10-year Treasury note yield (TNX) has staged a potentially consequential September breakout. Consider three technical levels:
The 2008 peak (4.33).
The 2022 peak (4.33).
The August 2023 peak (4.36).
Against this backdrop, the yield has knifed firmly atop resistance, rising after the Federal Reserve’s hawish-leaning policy directive.
In the process, the yield has tagged its highest level since October 2007.
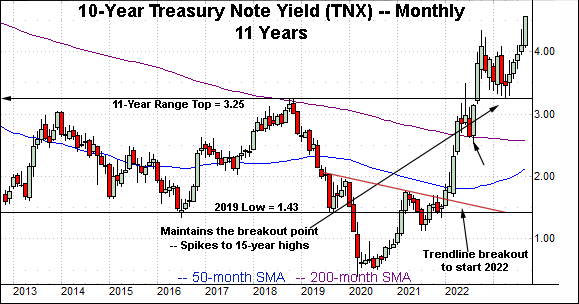
As always, rising interest rates (yields) present a stock-market headwind. But also consider the recent rate of change marks an added challenge. The September range spans as much as 50 basis points, as illustrated on the monthly chart.
Tactically, a longer-term yield target projects from the prior 11-month range to the 5.40 area. (The prior range spanned from the October 2022 peak (4.33) to the April 2023 low (3.25), a level precisely matching the yield’s breakout point at the 2018 peak (3.25).)
Also see Sept. 13: Charting a bull-bear stalemate, S&P 500 asserts range hinged to key level (4,460).


