Charting bullish follow-through, S&P 500 reclaims the 4,000 mark
Focus: Sector participation broadens amid rally attempt, Market breadth approaches bullish extremes, XLF, TRAN, XLI, SMH, XLV
Technically speaking, the major U.S. benchmarks have extended a July rally attempt, rising as sector participation continues to broaden.
Moreover, the prevailing upturn punctuates a successful test of major support — around S&P 3,920 and Nasdaq 11,560 — strengthening the intermediate-term bull case.
Editor’s Note: As always, updates can be directly accessed at https://chartingmarkets.substack.com.
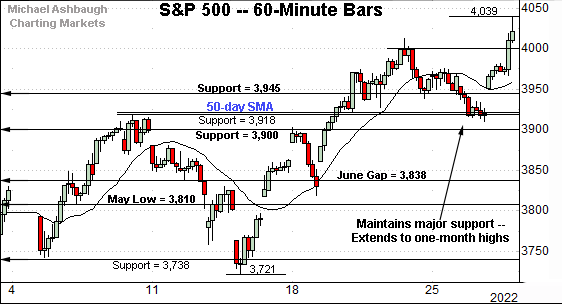
Before detailing the U.S. markets’ wider view, the S&P 500’s hourly chart highlights the past four weeks.
As illustrated, the S&P has extended its breakout.
The prevailing upturn punctuates a successful test of major support — the 3,900-to-3,920 area — detailed previously.
Tuesday’s close (3,921) registered nearby and has been punctuated by upside follow-through after the Fed’s policy statement. Bullish price action.
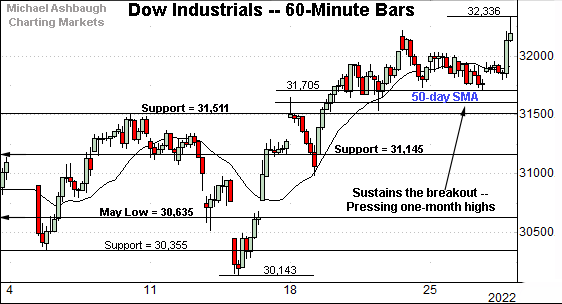
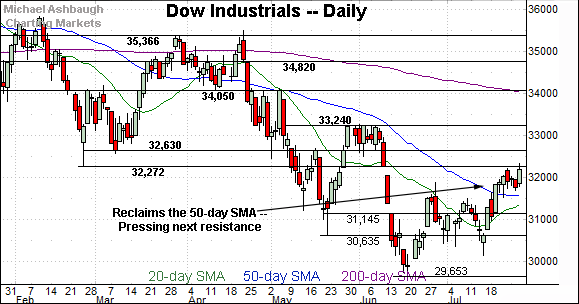
Similarly, the Dow Jones Industrial Average has tagged a nominal one-month high.
The prevailing flag-like pattern — the tight one-week range — signals still muted selling pressure, laying the groundwork for potential upside follow-through.
Tactically, the 50-day moving average, currently 31,590, is followed by the firmer breakout point (31,510).
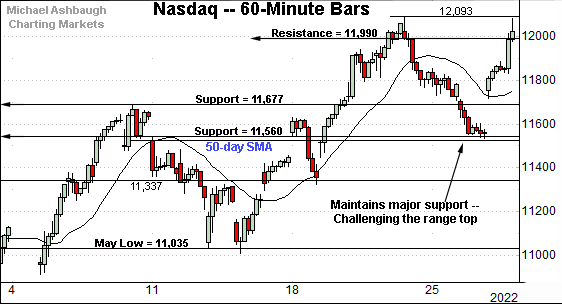
Against this backdrop, the Nasdaq Composite is challenging its range top.
Like the S&P 500, the Nasdaq’s prevailing upturn originates from major support (11,560).
Tuesday’s close (11,562) closely matched support.
The successful retest has been punctuated by a massive 470-point, or 4.06%, single-day spike after the Fed’s policy directive.
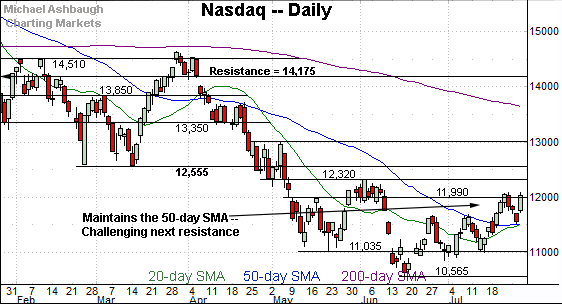
Widening the view to six months adds perspective.
On this wider view, the Nasdaq has sustained its recovery attempt, rising to once again challenge six-week highs.
To reiterate, a sustained posture atop the breakout point (11,677) and the 50-day moving average (11,522) signals a bullish-leaning intermediate-term bias.
Looking elsewhere, the Dow Jones Industrial Average has also sustained a July breakout.
Tactically, the 31,510-to-31,590 area marks support, levels matching the breakout point and the 50-day moving average. (Also see the hourly chart.)
A sustained posture atop this area signals a bullish-leaning intermediate-term bias.
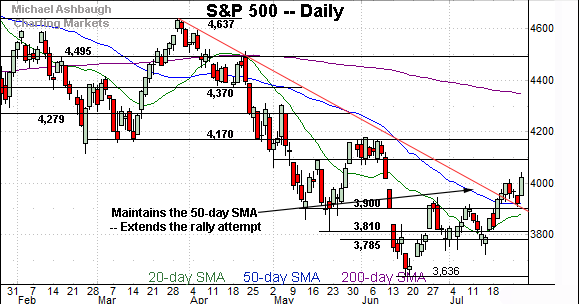
Meanwhile, the S&P 500 has reclaimed the 4,000 mark.
The prevailing upturn originates from the 50-day moving average, currently 3,920.
Recall Tuesday’s close (3,921) matched the 50-day moving average amid a successful retest.
The bigger picture
As detailed above, the U.S. benchmarks’ bigger-picture technical backdrop continues to strengthen.
On a headline basis, each big three benchmark has sustained its July breakout, rising respectably after the Federal Reserve’s policy statement.
Amid the upturn, the S&P 500 and Nasdaq Composite have maintained major support. (See the hourly charts.)
Moving to the small-caps, the iShares Russell 2000 ETF (IWM) has extended its rally attempt, edging atop resistance in the 182.50 area.
The prevailing upturn punctuates a tight one-week range underpinned by trendline support. Constructive price action.
Tactically, the breakout point (177.00) closely matches the 50-day moving average, currently 176.90. A sustained posture atop this area signals a bullish intermediate-term bias.
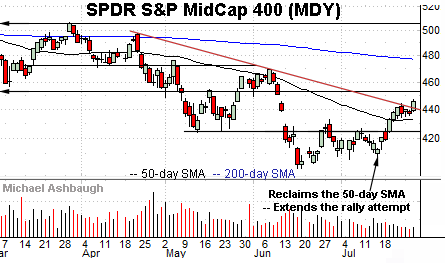
Similarly, the SPDR S&P MidCap 400 ETF (MDY) has tagged one-month highs.
Tactically, the prevailing rally attempt is intact barrring a violation of gap support (438.30) and the 50-day moving average, currently 432.80.
More broadly, the small- and mid-caps continue to rally amid lackluster volume, a lingering technical question mark.
Market breadth surges stregthening bull case
Moving to the internals, the July rally attempt has been fueled by improved market breadth.
For instance, the NYSE registered 6-to-1 positive breadth amid Wednesday’s Fed-fueled rally. (Advancing volume surpassed declining volume by a 6-to-1 margin.)
Broadening slightly, Wednesday’s spike follows the July 19 rally — seven sessions prior — an upturn fueled by nearly 10-to-1 positive breadth. (Each big three benchmark reclaimed its 50-day moving average on July 19.)
As always, two 9-to-1 updays — across about a seven-session window — reliably signals a major trend shift. (The early-2019 rally originated from two 9-to-1 up days across a precisely seven-session window.)
So in the current case, we have a 6-to-1 up day, and a nearly 10-to-1 up day, across a seven-session window. Not quite textbook bullish internals, but close.
Combine the internals with the recent price action, and the bull case has strengthened. At least for the intermediate-term.
Returning to the S&P 500, the index has extended its rally attempt.
On further strength, next resistance (4,090) is followed by major overhead matching the May breakdown point (4,170). Recall the aggressive June plunge from this area.
Conversely, the 3,900-to-3,920 area remains important support. As detailed previously, a sustained posture higher signals a bullish-leaning intermediate-term bias.
Beyond near-term issues, the more important primary trends remain bearish pending more extensive repairs.
Watch List — Sector participation broadens
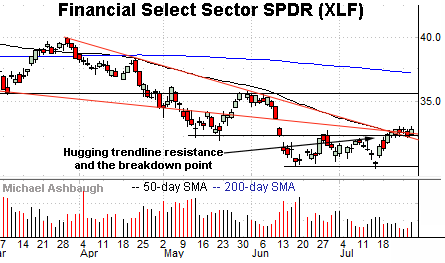
Drilling down further, the Financial Select Sector SPDR (XLF) has reached a headline technical test.
Specifically, the group is hugging its breakdown point — the 32.50 area — detailed previously. (See the July 14 review and July 19 review.)
Also recall trendline resistance closely tracks the 50-day moving average, currently 32.75. Sustained follow-through atop these areas would signal an intermediate-term trend shift.
Against this backdrop, the prevailing flag-like pattern — the tight one-week range — signals muted selling pressure near resistance, improving the chances of upside follow-through. Tactically, a breakout attempt is in play barrring a violation of the 32.10-to-32.50 area.
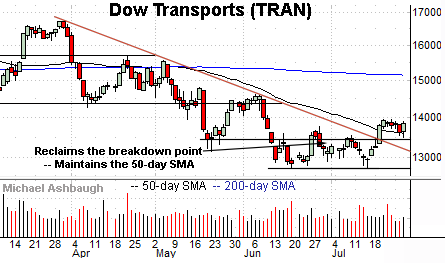
Meanwhile, the Dow Transports (TRAN) — profiled July 19 — continue to act well technically.
As illustrated, the group has sustained a break atop trendline resistance, and the 50-day moving average, currently 13,600.
Moreover, the prevailing upturn punctuates a double bottom — defined by the June and July lows — also signaling an intermediate-term trend shift.
Tactically, the group’s rally attempt is intact barring a violation of the former breakdown point (13,440).
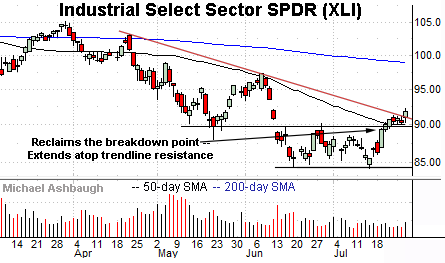
Looking elsewhere, the Industrial Select Sector SPDR (XLI) — profiled July 21 — has come to life technically.
Specifically, the group has reclaimed trendline resistance — amid increased volume — and placed distance atop its 50-day moving average.
Here again, the prevailing upturn punctuates a double bottom defined by the June and July lows.
Tactically, a sustained posture atop the former breakdown point (89.75) signals a bullish intermediate-term bias.
Similarly, the VanEck Semiconductor ETF (SMH) has sustained its recovery attempt.
Recall the prevailing upturn places the group atop trendline resistance loosely tracking the 50-day moving average.
Tactically, the 218.50-to-220.00 area remains an inflection point. The group’s rally attempt is intact barring a violation.
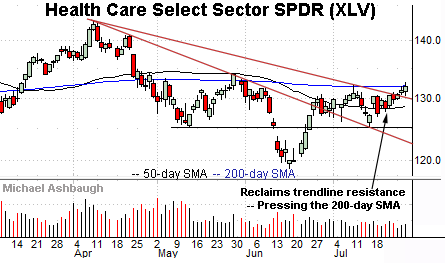
Finally, the Health Care Select Sector SPDR (XLV) has strengthened versus most other groups. (The energy sector remains the year’s best performer by a wide margin.)
As illustrated, the group has edged atop trendine resistance, rising to challenge the 200-day moving average, currently 132.06.
The prevailing upturn punctuates a head-and-shoulders bottom defined by the May, June and July lows.
Tactically, the 200-day moving average effectively matches the pattern’s neckline. Upside follow-through would resolve the bullish pattern, opening the path to a near-term target in the 136 area.


