Charting a (potential) bullish trend shift, S&P 500 stages trendline breakout
Focus: Sector rotation and key technical tests, Tesla's trendline breakout, SMH, KRE, XLI, XLP, TSLA
Technically speaking, the major U.S. benchmarks have extended a stealth mid-July resurgence.
In the process, each big three benchmark has notched consecutive closes atop its 50-day moving average — a widely-tracked intermediate-term trending indicator — raising the flag to a potential trend shift.
The rally attempt’s durability, and upside potential, remain major question marks based on today’s backdrop.
Editor’s Note: As always, updates can be directly accessed at https://chartingmarkets.substack.com.
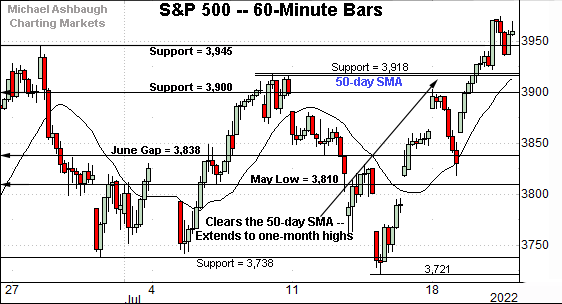
Before detailing the U.S. markets’ wider view, the S&P 500’s hourly chart highlights the past four weeks.
As illustrated, the S&P has broken out, tagging one-month highs.
The prevailing upturn punctuates a double bottom — the W formation — defined by the one-month range bottom.
Tactically, the former range top (3,945) is followed by support matching the 50-day moving average, currently 3,918.
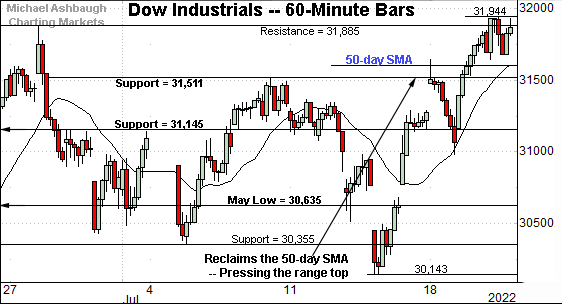
Meanwhile, the Dow Jones Industrial Average has edged to one-month highs.
Here again, the prevailing steep one-week rally punctuates a double bottom — a bullish reversal pattern — defined by the July lows.
Tactically, the 50-day moving average, currently 31,582, is followed by the firmer breakout point (31,510).
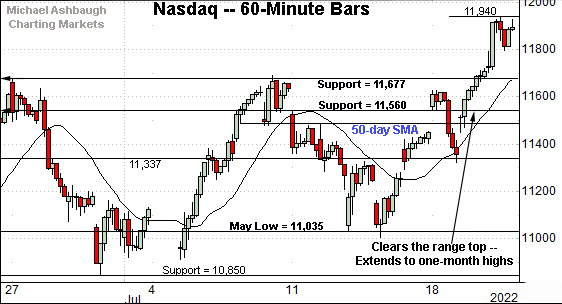
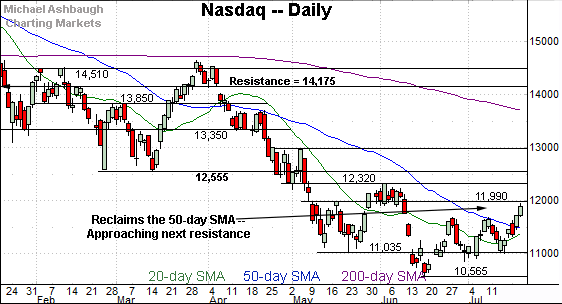
Against this backdrop, the Nasdaq Composite has knifed more aggressively to one-month highs.
In the process, the index has placed distance comfortably atop its 50-day moving average.
Tactically, the breakout point — the 11,677-to-11,689 area — pivots to support.
(Recall the Nasdaq previously registered a bullish divergence, detailed last week.)
Widening the view to six months adds perspective.
On this wider view, the Nasdaq has come to life technically.
Specifically, the index has placed distance atop its 50-day moving average, currently 11,494, also notching a “higher high” versus the early-July peak.
Moreover, the prevailing upturn punctuates a “higher low” versus the June low.
So these are the hallmarks of an intermediate-term trend shift.
Tactically, the breakout point (11,677) pivots to support. A sustained posture higher signals a bullish-leaning intermediate-term bias.
More immediately, additional overhead (11,990) matches the May gap.
Looking elsewhere, the Dow Jones Industrial Average has broken out less aggressively.
Nonetheless, the index has reclaimed its 50-day moving average, currently 31,586, notching consecutive closes higher.
Tactically, the 31,510-to-31,580 area pivots to support. A sustained posture higher signals a bullish-leaning intermediate-term bias. (Also see the hourly chart.)
Delving deeper, the prevailing upturn originates from the July closing low (30,630) — established last week — a level closely matching major support (30,635) also detailed on the hourly chart.
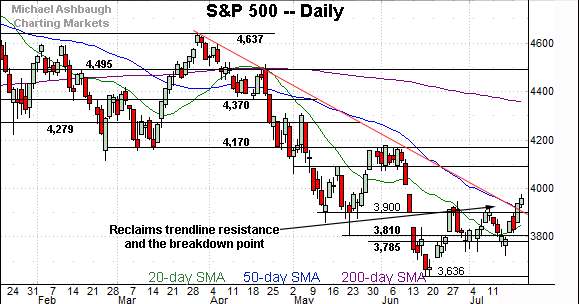
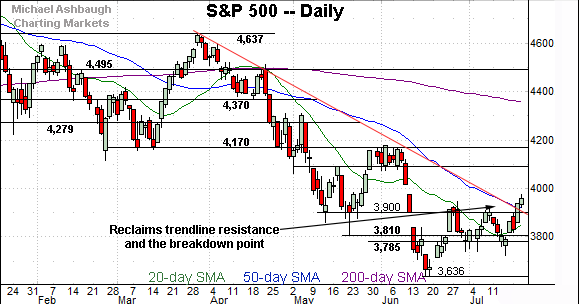
Meanwhile, the S&P 500 has staged a trendline breakout.
Recall the trendline closely tracks the 50-day moving average, currently 3,918.
Delving slightly deeper, the S&P’s former breakdown point (3,900) pivots to notable support. A sustained posture higher signals a bullish-leaning intermediate-term bias.
The bigger picture
As detailed above, the major U.S. benchmarks have extended a stealth mid-July resurgence.
On a headline basis, each big three benchmark has notched consecutive closes atop its 50-day moving average, raising the flag to an intermediate-term trend shift.
Against this backdrop, the prevailing upturn gets mixed marks for style (as measured by volume, internals and price action) — amid a still daunting primary downtrend — placing the rally attempt’s sustainability, and upside potential, in question.
Put differently, the prevailing upturn has not yet signaled a clear “bright line” shift in market structure despite admittedly constructive price action in key spots.
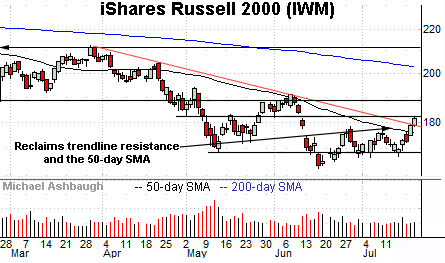
Moving to the small-caps, the iShares Russell 2000 ETF (IWM) has extended a rally attempt.
In the process, the shares have placed distance above the 50-day moving average, currently 176.20, rising to close atop trendline resistance.
To be sure, the upturn has been fueled by lackluster volume, placing the rally’s sustainability in question.
Nonetheless, the former range top — the 177.00 area — pivots to support. A sustained posture higher signals a bullish-leaning bias.
Conversely, additional overhead rests in the 182.50 area.
(On a granular note, the 50-day moving average’s slope has ticked fractionally higher, also consistent with a trend shift.)
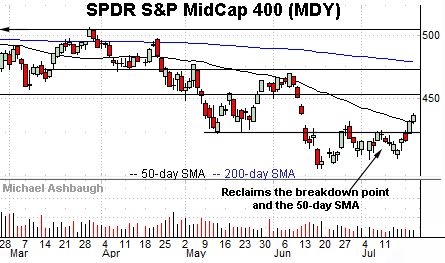
Meanwhile, the SPDR S&P MidCap 400 ETF (MDY) has knifed to one-month highs, rising to reclaim the 50-day moving average, currently 432.35.
But here again, the breakout has been punctuated by lukewarm volume, raising a technical question mark.
Tactically, the former breakdown point (424.30) pivots to support. The MDY’s recovery attempt is intact barring a violation.
Returning to the S&P 500, the index has extended its recovery attempt, building on a bullish near-term bias, initially signaled July 7. (Also see the July 12 review.)
Tactically, the prevailing upturn places the S&P atop its breakdown point (3,900) as well as trendline resistance tracking the 50-day moving average.
Moreover, the week-to-date peak (3,987) punctuates a material “higher high” also consistent with an intermediate-term trend shift.
Tactically, the 3,900-to-3,918 area pivots to notable support. A sustained posture atop this area signals a bullish-leaning intermediate-term bias.
More broadly, the S&P 500’s longer-term trend remains bearish, based on today’s backdrop.
Market Sentiment — as measured by VIX — Lingers as Market overhang
On a granular, but important note, the CBOE Volatility Index (VIX) has closed under its 200-day moving average for the first time in exactly three months. This year’s prior VIX pullbacks under the 200-day moving average (see mid-January, and late-March/early-April) were punctuated by swift volatility spikes, and correspondingly aggressive S&P 500 downdrafts.
Watch List — Sector rotation and key technical tests
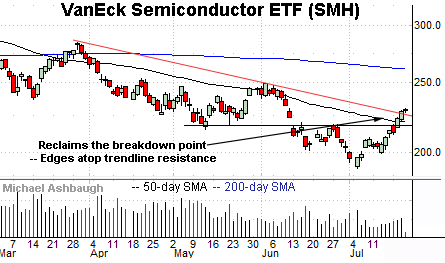
Drilling down further, the VanEck Semiconductor ETF (SMH) is showing signs of life.
As illustrated, the group has reclaimed its breakdown point and trendline resistance loosely tracking the 50-day moving average.
Tactically, the 218.50-to-220.00 area pivots to support. The group’s recovery attempt is intact barring a violation.
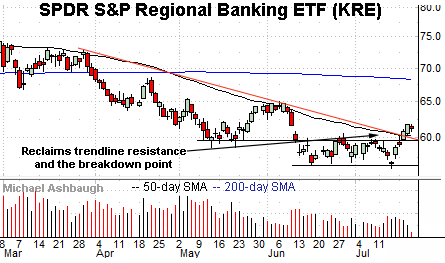
Similarly, the SPDR S&P Regional Banking ETF (KRE) has come to life technically.
Here again, the group has reclaimed its breakdown point, as well as trendline resistance, in this case closely tracking the 50-day moving average.
Tactically, the 59.50 area marks a notable floor. The prevailing rally attempt is intact barring a violation.
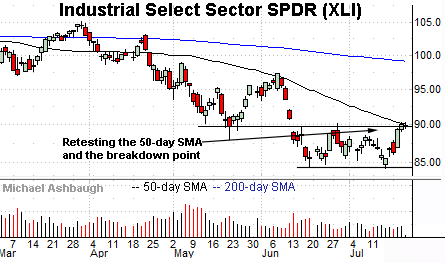
Looking elsewhere, the Industrial Select Sector SPDR (XLI) has reached a potentially consequential technical test.
Specifically, the group is challenging its breakdown point (89.75) an area closely matching the 50-day moving average, currently 90.14.
The prevailing upturn punctuates a double bottom defined by the June and July lows. Tactically, follow-through atop resistance would signal an intermediate-term trend shift. The weekly close may add color.
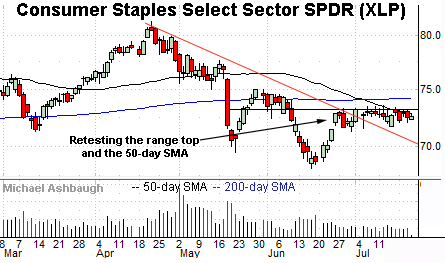
Meanwhile, the Consumer Staples Select Sector SPDR (XLP) has reached an extended technical test.
Specifically, the group is challenging a one-month range top (73.20) and the 50-day moving average, currently 72.92.
Notably, the group has yet to register a July close atop the 50-day moving average, a recent a bull-bear inflection point. (See the mid-May downdraft.)
Tactically, eventual follow-through atop resistance would mark technical progress. The group’s intermediate-term bias remains bearish-leaning based on today’s backdrop.
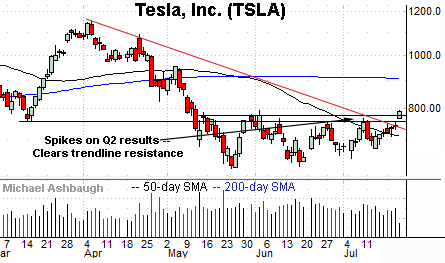
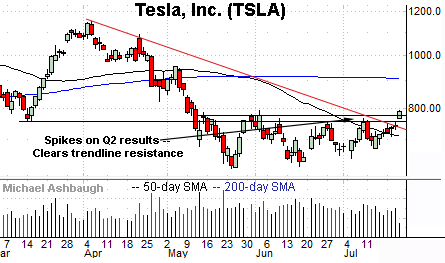
Finally, Tesla, Inc. (TSLA) is vying to take flight.
As illustrated, the shares have knifed atop trendline resistance, rising after the company’s well received second-quarter results.
The prevailing upturn places Tesla’s two-month high (792.63) under siege.
Tactically, gap support (764.60) closely matches the breakout point (764.90). Tesla’s rally attempt is intact barring a violation.

