Market bears resurface as S&P 500 challenges major support (3,785)
Focus: Transports and financials challenge major support, Global-market cross currents persist, XLF, TRAN, FXI, EWJ, IEV
Technically speaking, the major U.S. benchmarks are vying to stabilize amid a less-than-auspicious July earnings season start.
Against this backdrop, the S&P 500 has pulled in to a headline test — the 3,785-to-3,810 area — levels defining the immediate bull-bear battleground. The response to this area, potentially across the next several sessions, will likely add color.
Editor’s Note: As always, updates can be directly accessed at https://chartingmarkets.substack.com.
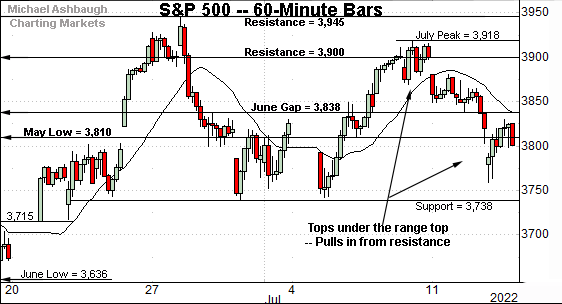
Before detailing the U.S. markets’ wider view, the S&P 500’s hourly chart highlights the past four weeks.
As illustrated, the S&P is traversing a three-week range amid sluggish July price action. From the late-June low (3,738) to the July peak (3,918) the range spans 180 points, or about 4.8%.
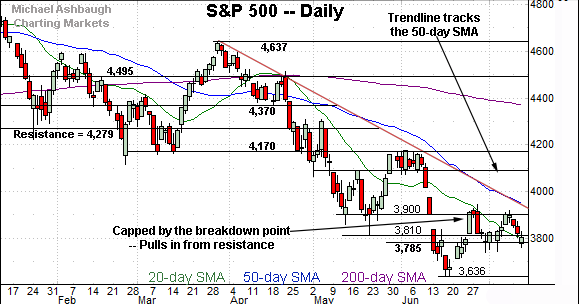
Tactically, the prevailing pullback originates from major resistance (3,900) an area better illustrated on the daily chart.
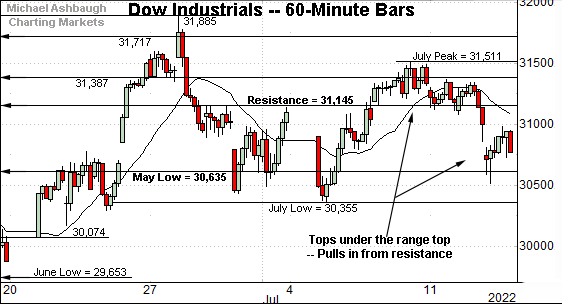
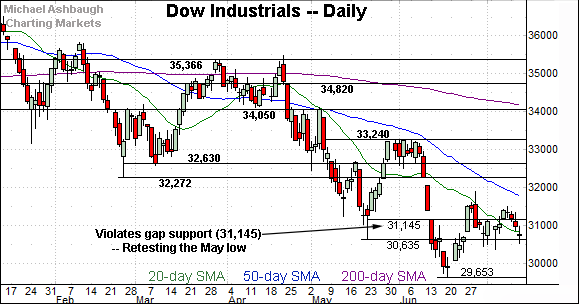
Similarly, the Dow Jones Industrial Average remains range-bound.
Its prevailing range — from the July low, to the July peak — spans 1,156 points, or 3.8%.
Tactically, the prevailing downturn punctuates a violation of gap support (31,145), an area better illustrated on the daily chart.
Combined, the S&P 500 and Dow industrials have recently topped under the June peak.
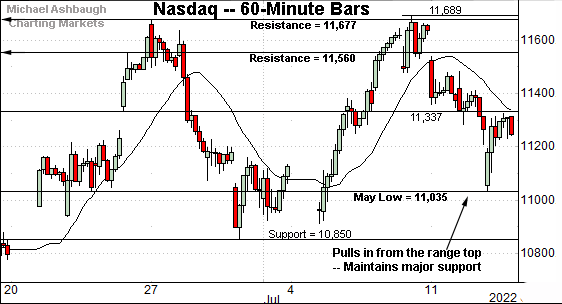
Against this backdrop, the Nasdaq Composite has diverged slightly amid a July whipsaw.
Recall its upturn tagged the range top (11,677) outpacing the other benchmarks.
Separately, the Nasdaq has more closely observed well-defined technical levels, even amid wide-ranging price action.
For instance, Wednesday’s session low (11,031) closely matched the May low (11,035). (Here again, exhibiting relative strength versus the other benchmarks.)
Conversely, Wednesday’s session high (11,325) registered near gap resistance (11,337). (Also see Tuesday’s review.)
Slightly more broadly, recall the July peak (11,689) registered within 12 points of the one-month range top.
(On a granular note, the Nasdaq’s prevailing three-week range spans 839 points, or 7.7%.)
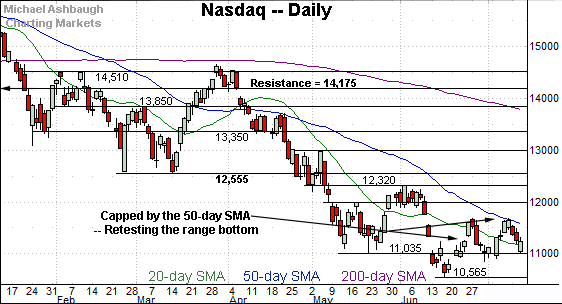
Widening the view to six months adds perspective.
On this wider view, the Nasdaq has rattled two key technical levels across just four sessions.
To reiterate, Wednesday’s session low (11,031) closely matched the May low (11,035). A closing violation of this area would wreck the Nasdaq’s recovery attempt.
Conversely, the prevailing pullback originates from the range top (11,677) an area then closely matching the 50-day moving average.
Tactically, upside follow-through above the range top (11,677) would mark a “higher high” — combined with a rally atop the 50-day moving average — signaling an intermediate-term trend shift.
Looking elsewhere, the Dow Jones Industrial Average has topped firmly under its 50-day moving average.
The prevailing pullback places it back under gap support (31,145), a recent bull-bear inflection point.
More broadly, the Dow’s bigger-picture path of least resistance continues to point lower. The index has asserted a series of “lower highs” hinged to the April peak.
Also see the aggressive June downdraft punctuated by a comparably lackluster rally attempt.
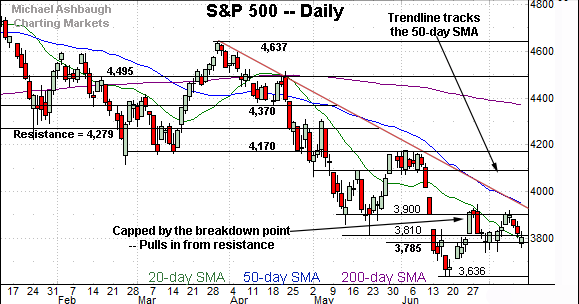
Meanwhile, the S&P 500 has extended a pullback from major resistance.
Recall the breakdown point (3,900) marks a headline hurdle, matching the May closing low (3,900) and the top of the June gap (3,900).
Against this backdrop, the July closing high (3,902) — established last week — and last week’s close (3,899) have registered nearby.
More broadly, the 3,900 mark correlates with the 4,170 resistance. The aggressiveness of the prevailing pullback remains an open question.
The bigger picture
As detailed above, the major U.S. benchmarks are vying to stabilize for the near-term, though against a still firmly-bearish bigger-picture backdrop.
Amid the cross currents, the S&P 500 has extended a downturn its breakdown point (3,900) while the Nasdaq has pulled in from its 50-day moving average.
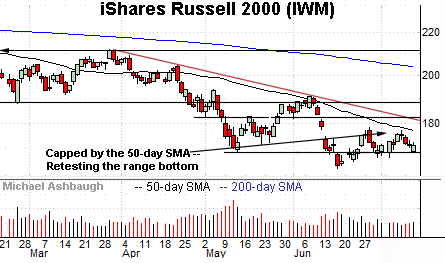
Moving to the small-caps, the iShares Russell 2000 ETF (IWM) is tenuously positioned.
The flattish July rally attempt has topped under the 50-day moving average, placing its former range bottom — the 169.35-to-169.80 area — back in play.
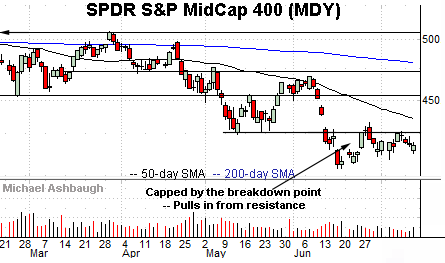
True to recent form, the SPDR S&P MidCap 400 ETF (MDY) continues to underperform the widely-tracked U.S. benchmarks.
Tactically, the breakdown point (424.30) remains an overhead hurdle, an area roughly matching last week’s close (424.35).
Returning to the S&P 500, the index is not acting especially well technically.
Nonetheless, the 3,785-to-3,810 area — levels matching the June close, and May low, respectively — marks a foothold for the S&P’s prevailing recovery attempt.
The July closing low (3,801) — established Wednesday — registered within the caution zone.
Against this backdrop, the S&P’s recovery attempt “has a chance” to the extent it maintains 3,785 on a closing basis. The weekly close will likely add color.
Conversely, the S&P’s breakdown point (3,900) is followed by trendline resistance tracking the 50-day moving average, currently 3,941.
Recall the one-month range top (3,945) matches this area. (See the hourly chart.)
So tactically, sustained follow-through atop the 3,945 area would raise the flag to an intermediate-term trend shift.
Beyond technical levels, the S&P 500’s bigger-picture trends remain bearish, based on today’s backdrop, pending repairs.
Watch List
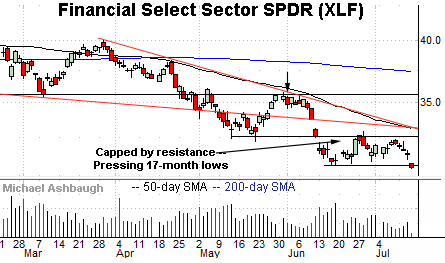
Drilling down further, the Financial Select Sector SPDR (XLF) is challenging 17-month lows.
The prevailing downturn originates from resistance — the 32.10-to-32.50 area — detailed previously. (See the June 23 review.)
The July peak (32.34) has registered nearby.
More broadly, the prevailing downturn punctuates a one-month range capped by trendline resistance. The 50-day moving average closely tracks the downtrend.
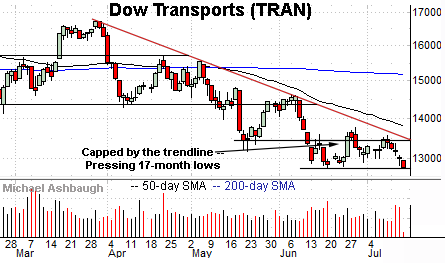
Similarly, the Dow Transports (TRAN) are pressing 17-month lows.
The prevailing downturn originates from the breakdown point, an area closely matching trendline resistance.
Combined, the financials and transports are traditional sector leaders. Both groups are currently trending lower.
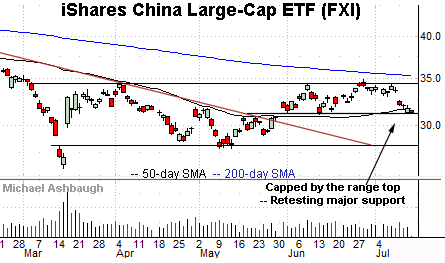
Beyond the U.S., the iShares China Large-Cap ETF (FXI) has reached a headline technical test.
Specifically, the shares are pressing major support — the 31.10-to-31.30 area — detailed previously. (See the June 30 review.)
Wednesday’s session low (31.31) matched support amid an extended retest that remains underway.
Separately, the 50-day moving average, currently 31.68, has marked an inflection point. See the May trendline breakout, and subsequent successful retest.
Tactically, a closing violation of the 31.30 area would raise a caution flag. Note the prevailing pullback originates from the range top amid a third failed test from underneath.
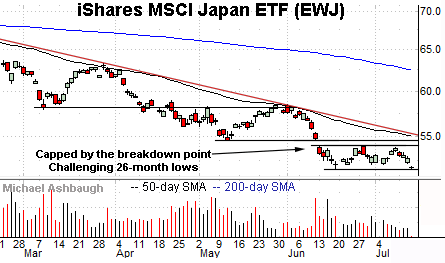
Elsewhere, the iShares MSCI Japan ETF (EWJ) is challenging 26-month lows.
The prevailing downturn punctuates a one-month range — a bearish continuation pattern — laying the groundwork for potential downside follow-through.
Tactically, a near-term target projects to the 49.50 area on a violation of the range bottom.
More broadly, trendline resistance closely tracks the 50-day moving average.
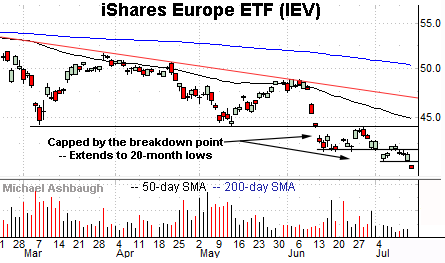
Finally, the iShares Europe ETF (IEV) has confirmed its downtrend, reaching 20-month lows.
More broadly, the shares returned to pandemic-era territory with the mid-June downdraft. (See the five-year chart.)
The downturn opens the path to a less-charted patch, and already notable downside follow-through, an incremental 8.5%.
Tactically, gap resistance (41.00) is closely followed by the former range bottom (41.90). A reversal atop this area would mark a step toward stabilization.


