Charting a bullish reversal, S&P 500 back for third crack at the breakdown point (3,900)
Focus: Small-caps challenge 50-day average, Transports clear key trendline, Financials press major resistance, Apple and Ford Motor Co. stage trendline breakouts, TRAN, XLF, F, AAPL
Technically speaking, the major U.S. benchmarks remain in recovery mode, even amid persistently jagged July price action.
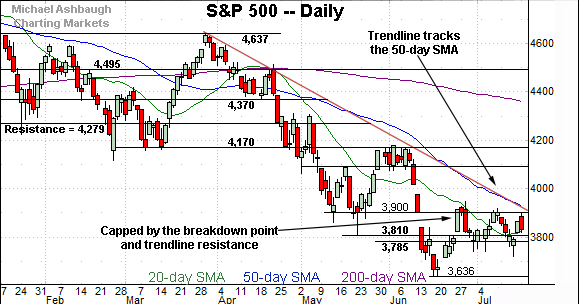
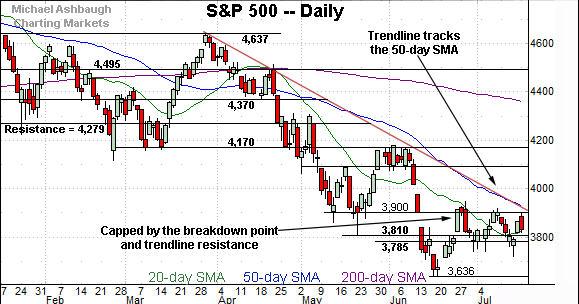
Against this backdrop, the S&P 500 has rallied to its third recent test of the breakdown point (3,900), an area followed by slightly more distant trendline resistance.
As always, major resistance is frequently cleared on the third or fourth independent test.
Editor’s Note: As always, updates can be directly accessed at https://chartingmarkets.substack.com.
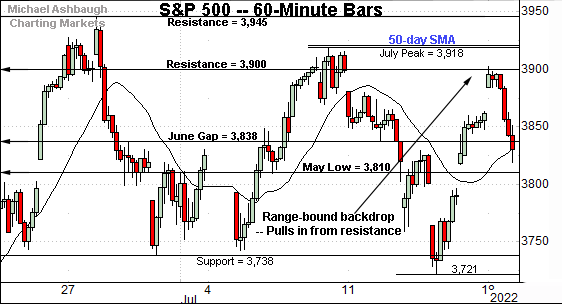
Before detailing the U.S. markets’ wider view, the S&P 500’s hourly chart highlights the past four weeks.
As illustrated, the S&P has tagged major resistance (3,900) an area also illustrated on the daily chart.
Monday’s session high (3,902) registered nearby amid a retest that remains underway.
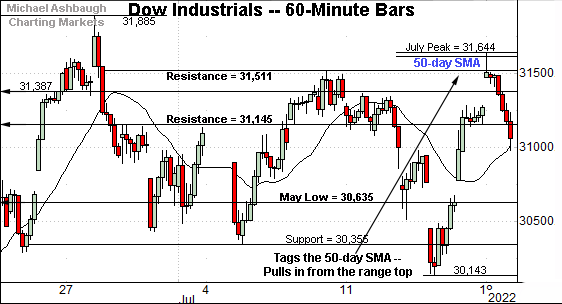
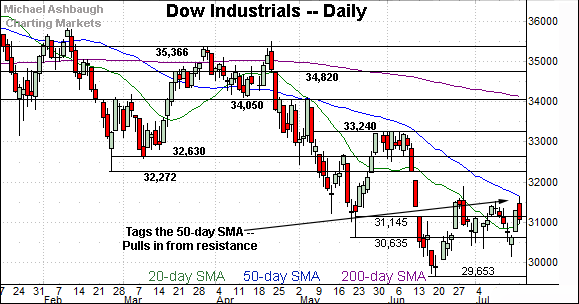
Similarly, the Dow Jones Industrial Average is pressing its range top.
In the process, the index has tagged its 50-day moving average, currently 31,608.
Monday’s session high registered within eight points of the 50-day moving average amid a retest that remains underway.
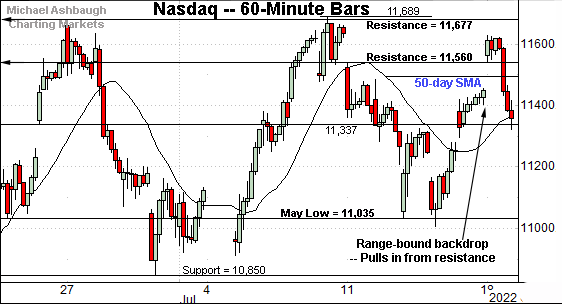
Against this backdrop, the Nasdaq Composite has reached an equally notable test.
Specifically, the index continues to press its 50-day moving average, currently 11,489, an area better illustrated on the daily chart below.
(On a granular note, Monday’s session open (11,561) closely matched familiar resistance (11,560) detailed repeatedly.)
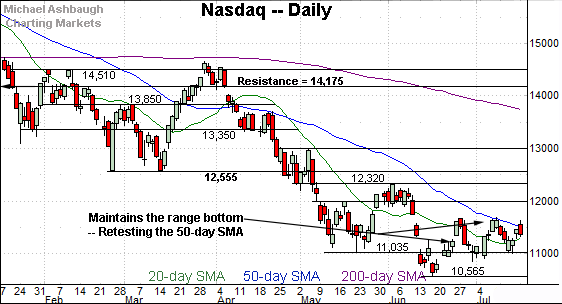
Widening the view to six months adds perspective.
On this wider view, the Nasdaq continues to challenge its 50-day moving average, currently 11,489.
As always, the 50-day moving average is a widely-tracked intermediate-term trending indicator.
On further strength, the 11,677-to-11,689 area marks major resistance also detailed on the hourly chart. Follow-through atop this area would mark a material “higher high” raising the flag to an intermediate-term trend shift.
Conversely, the prevailing upturn originates from major support (11,035).
Looking elsewhere, the Dow Jones Industrial Average has briefly tagged its 50-day moving average.
Monday’s session high registered within eight points of the trending indicator and respectable selling pressure did indeed surface.
Broadly speaking, the 31,510-to-31,610 area marks major resistance. (Also see the hourly chart.)
Sustained follow-through atop this area would raise the flag to a potential trend shift.
Meanwhile, the S&P 500 has once again tagged familiar resistance.
Recall the breakdown point (3,900) marks a headline hurdle, matching the May closing low (3,900), the top of the June gap (3,900) and the July closing high (3,902).
Monday’s session high (3,902) matched resistance amid a retest that remains in play.
Slightly more broadly, trendline resistance tracks the 50-day moving average, currently 3,922.
The bigger picture
As detailed above, the major U.S. benchmarks have thus far sustained a recovery attempt even amid jagged July price action.
Against this backdrop, the Dow industrials and Nasdaq Composite have concurrently tagged the 50-day moving average, while the S&P 500 continues to challenge its breakdown point (3,900).
The pending selling pressure in these areas, or lack thereof, will likely add color.
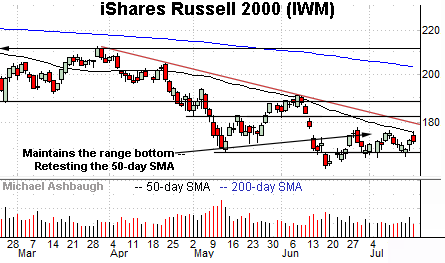
Moving to the small-caps, the iShares Russell 2000 ETF (IWM) has registered sideways July price action.
Tactically, follow-through atop the 50-day moving average, currently 176.10, and the late-June peak (178.15) would strengthen the bull case. The trendline is descending toward this area.
Conversely, familiar support rests in the 169.80 area.
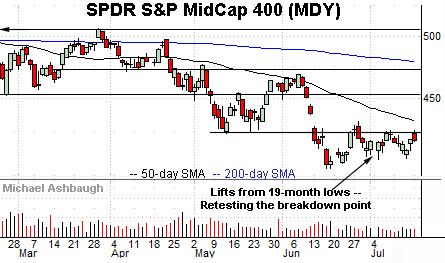
True to recent form, the SPDR S&P MidCap 400 ETF (MDY) continues to underperform the widely-tracked U.S. benchmarks.
Tactically, an extended test of the breakdown point (424.30) remains underway.
On further strength, the 50-day moving average, currently 432.60, is closely followed by the late-June peak (433.07). Follow-through atop this area would raise the flag to an intermediate-term trend shift.
Returning to the S&P 500, the index has preserved a slightly bullish pulse.
Tactically, recall the 3,785-to-3,810 area — levels matching the June close, and May low, respectively — marks a foothold for the S&P’s recovery attempt. (See the July 12 review.)
The July closing low (3,790) — established July 14 — punctuated a shaky, but successful, retest.
More immediately, the S&P’s breakdown point (3,900) is followed by trendline resistance tracking the 50-day moving average, currently 3,922.
Slightly more distant overhead matches the S&P’s one-month range top (3,945). (See the hourly chart.)
So collectively, the S&P 500’s recovery attempt — its bullish near-term bias — is intact based on today’s backdrop.
More broadly, upside follow-through atop the 3,900-to-3,945 area would raise the flag to an intermediate-term trend shift. The next several sessions — and the response to the Federal Reserve’s next policy directive, due out July 27 — will likely add color.
Watch List
Drilling down further, the Dow Transports (TRAN) are showing signs of life technically.
As illustrated, the group has edged atop trendline resistance, an area closely matching the June breakdown point (13,440).
The prevailing upturn originates from a successful test of the range bottom last week.
On further strength, the 50-day moving average, currently 13,684, is closely followed by the late-June peak (13,773). Follow-through atop this area would punctuate a double bottom — defined by the June and July lows — more firmly signaling an intermediate-term trend shift.
Meanwhile, the Financial Select Sector SPDR (XLF) continues to lag slightly behind the transports.
Still, the group has rallied to challenge familiar resistance — the 32.10-to-32.50 area — detailed last week. (See the July 14 review.)
The week-to-date peak (32.45) has closely matched resistance.
On further strength, trendline resistance closely tracks the 50-day moving average, currently 32.88. Sustained follow-through higher would signal an intermediate-term trend shift.
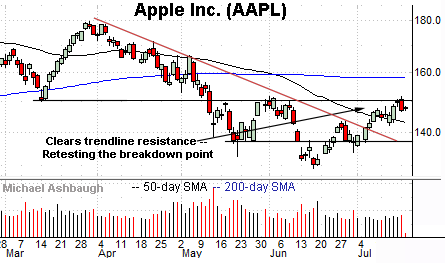
Moving to specific names, Dow 30 component Apple, Inc. (AAPL) — profiled July 7 — has extended its recovery attempt.
The prevailing upturn places its breakdown point — the 151.10-to-152.20 area, detailed previously — under siege.
The week-to-date peak (151.57) has matched resistance.
Tactically, follow-through atop this area would confirm Apple’s uptrend, likely opening the path to an eventual retest of the 200-day moving average, currently 158.40. The next several sessions will likely add color.
Note the company’s quarterly results are due out July 28.
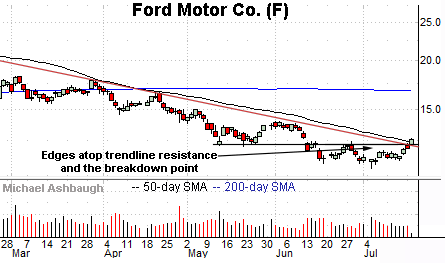
Finally, Ford Motor Co. (F) is a large-cap name coming to life.
As illustrated, the shares have edged atop trendline resistance closely tracking the 50-day moving average, currently 12.43. The upturn punctuates a relatively tight one-month range and signals a trend shift.
Tactically, the former breakdown point (12.25) pivots to support. The prevailing rally attempt is intact barring a violation.
Note the company’s quarterly results are due out July 27.


