S&P 500 vies to sustain trendline breakout amid 10% rally from 2022 low
Focus: Global markets - Japan, Europe and China - reach key technical tests: EWJ, IEV, FXI
Technically speaking, the major U.S. benchmarks have thus far sustained a July rally attempt ahead of the Federal Reserve’s widely-anticipated policy statement, due out mid-week.
Against this backdrop, the S&P 500 is digesting a key trendline breakout in the wake of an almost precisely 10% rally from the June low.
Editor’s Note: As always, updates can be directly accessed at https://chartingmarkets.substack.com.
Before detailing the U.S. markets’ wider view, the S&P 500’s hourly chart highlights the past four weeks.
As illustrated, the S&P is vying to sustain its break to one-month highs.
Tactically, the breakout point (3,945) is followed by the 50-day moving average, currently 3,920.
(On a granular note, the prevailing retest of support (3,945) has been capped by the 20-hour moving average, a very near-term trending indicator.)
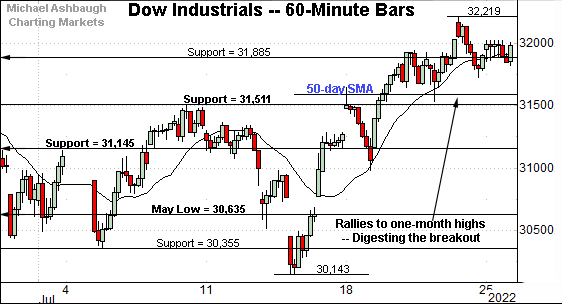
Meanwhile, the Dow Jones Industrial Average has also sustained a recent breakout.
Tactically, the former range top (31,885) marks an inflection point.
Delving deeper, the 50-day moving average, currently 31,588, is followed by the firmer breakout point (31,510).
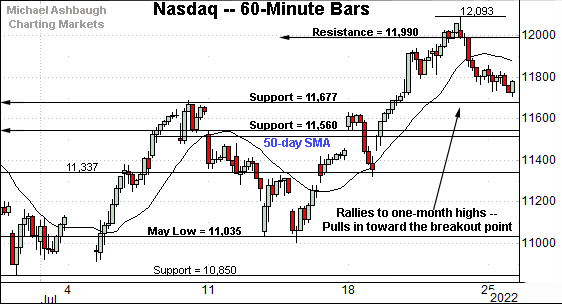
Similarly, the Nasdaq Composite has pulled in from one-month highs.
From current levels, the breakout point (11,677) is followed by the 50-day moving average, areas also detailed on the daily chart below.
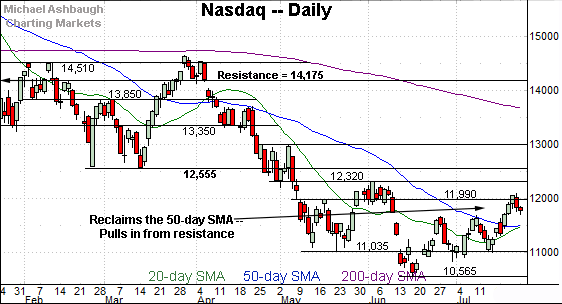
Widening the view to six months adds perspective.
On this wider view, the Nasdaq is digesting a late-July breakout.
Recall the recent rally atop the 50-day moving average, currently 11,510, also punctuates a “higher high” versus the early-July peak.
The upturn raises the flag to an intermediate-term trend shift.
Tactically, a sustained posture atop the breakout point (11,677) and the 50-day moving average (11,510) signals a bullish-leaning intermediate-term bias.
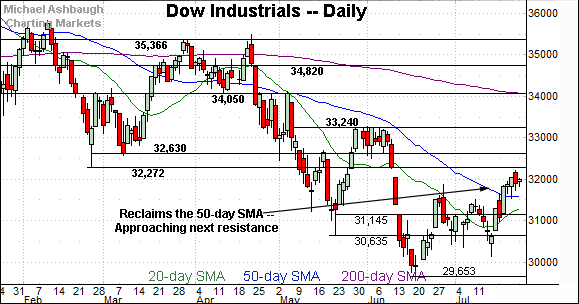
Looking elsewhere, the Dow Jones Industrial Average has also broken out.
Here again, the prevailing upturn places the index at one-month highs.
Tactically, the 31,510-to-31,590 area broadly marks support. A sustained posture higher signals a bullish-leaning intermediate-term bias. (Also see the hourly chart.)
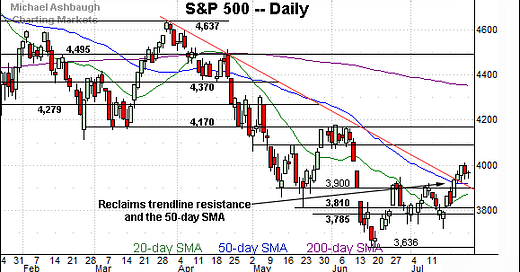
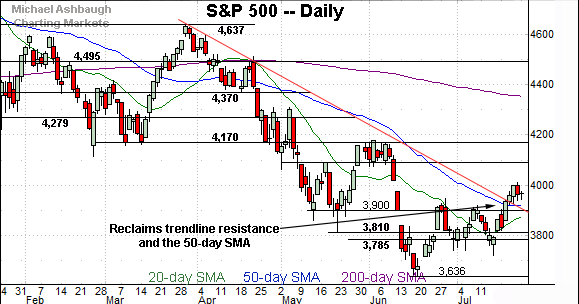
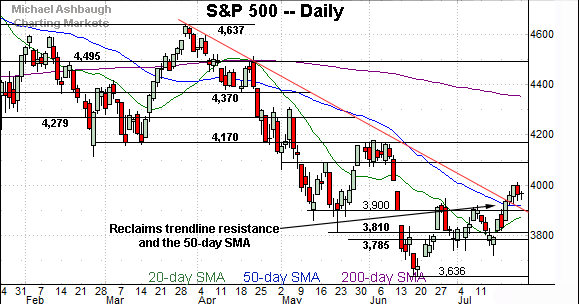
Meanwhile, the S&P 500 is vying to sustain a trendline breakout.
Recall the trendline closely tracks the 50-day moving average, currently 3,920.
Delving slightly deeper, the S&P’s former breakdown point (3,900) marks notable support. A sustained posture higher signals a bullish-leaning intermediate-term bias.
The bigger picture
As detailed above, the major U.S. benchmarks have shown signs of life technically.
On a headline basis, each big three benchmark has thus far sustained its break atop the 50-day moving average, a widely-tracked intermediate-term trending indicator.
But amid the upturn, the recovery attempt continues to get mixed marks for style. The prevailing rally has not marked a definitive stake-in-the-ground bullish reversal.
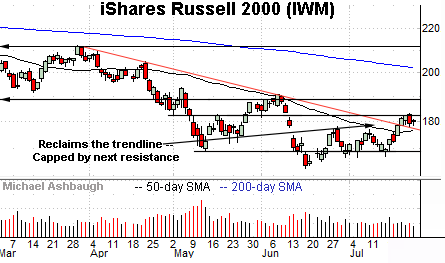
Moving to the small-caps, the iShares Russell 2000 ETF (IWM) has sustained a modest trendline breakout.
Tactically, the 182.50 area remains an overhead inflection point.
Conversely, the former range top (177.00) is followed by the 50-day moving average, currently 176.64. A posture atop this area signals a bullish-leaning bias.
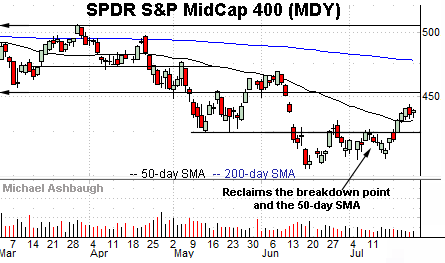
Meanwhile, the SPDR S&P MidCap 400 ETF (MDY) has sustained a modest break atop the 50-day moving average, currently 432.75.
Delving deeper, the former breakdown point (424.30) pivots to support. The MDY’s recovery attempt is intact barring a violation.
More broadly, the small- and mid-caps have rallied amid distinctly lackluster volume raising a question mark. A valid trend shift would conventionally be fueled by a volume spike, or least increased volume.
Returning to the S&P 500, the index has registered a 10% rally from the 2022 low.
More precisely, the July closing high (3,998.95) punctuates a 9.96% rally from the June low (3,636.87) across about five weeks.
Put differently, the 4,000 mark rests exactly 10% above the June low, and this area has capped the rally attempt.
(As reference, the rally from the May low to the June peak spanned 9.64%.)
Tactically, the 3,900-to-3,920 area remains important support. A sustained posture higher signals a bullish-leaning intermediate-term bias. (This area matches the June gap (3,900), the May closing low (3,900), the trendline, and the 50-day moving average (3,920).)
More broadly, the S&P 500’s primay trend remains bearish based on today’s backdrop.
The response to the Federal Reserve’s policy statement, due out Wednesday, will likely add color. Separately, this week’s close also marks a monthly close, and should add color.
Watch List — Global markets reach key technical tests
Drilling down further, the iShares MSCI Japan ETF (EWJ) has reached a headline technical test.
Specifically, the shares are challenging trendline resistance closely tracking the 50-day moving average, currently 54.70.
The trendline also closely matches the breakdown point (54.55).
Tactically, upside follow-through would raise the flag to an intermediate-term trend shift. Conversely, a failed retest from underneath preserves the prevailing downtrend. The next several sessions may add color.
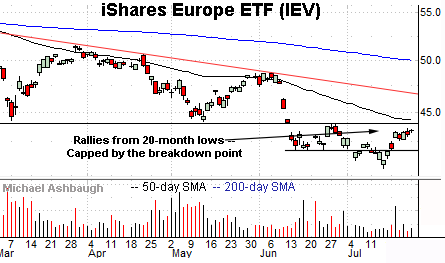
Meanwhile, the iShares Europe ETF (IEV) has reversed from 20-month lows.
Tactically, the breakdown point (44.00) is closely followed by the 50-day moving average, currently 44.34. The prevailing backdrop supports a bearish bigger-picture bias pending sustained follow-through atop this area.
More broadly, recall the June downdraft returned the shares to pandemic-era territory. (See the five-year chart.)
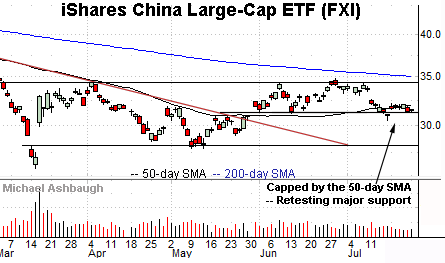
Finally, the iShares China Large-Cap ETF (FXI) has reached an extended technical test.
Specifically, the shares are pressing major support — the 31.10-to-31.30 area — detailed previously. (See the June 30 review and July 14 review.)
Last week’s close (31.30) matched support.
The week-to-date low (31.29) has also registered nearby.
To reiterate, a closing violation of the 31.30 area would raise a caution flag.
Conversely, a rally atop the 50-day moving average, currently 32.04, and the mid-July peak (32.15) would place the shares on firmer footing.

