Charting a market downdraft: S&P 500, Nasdaq nail major support
Focus: U.S. sector backdrop continues to crack, Silver violates 200-day average, Japan challenges major support, XLF, TRAN, XLB, XME, SLV, EWJ
U.S. stocks are firmly lower early Monday, pressured amid heightened virus-related concerns, and in sympathy with pronounced weakness overseas.
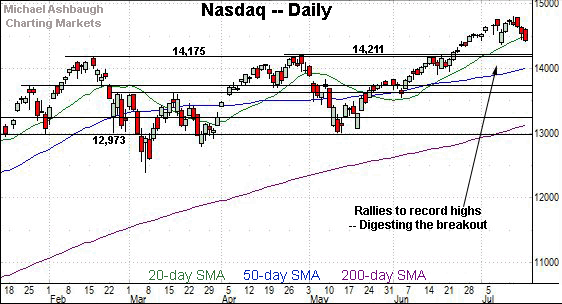
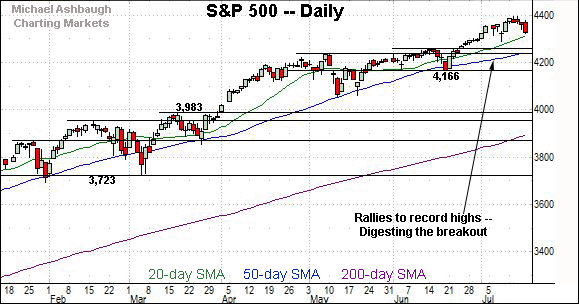
Against this backdrop, the S&P 500 has tagged its 50-day moving average, currently 4,240, while the Nasdaq Composite has effectively nailed its breakout point (14,175). The session close, and the next several sessions, will likely add color.
Editor’s Note: As always, updates can be directly accessed at chartingmarkets.substack.com.
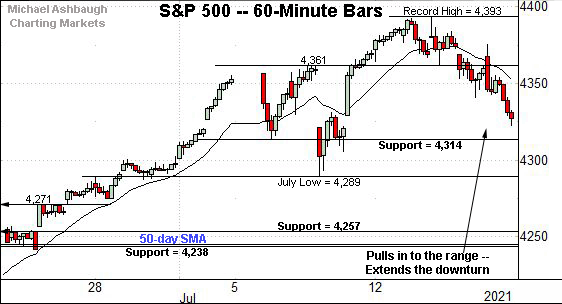
Before detailing the U.S. markets’ wider view, the S&P 500’s hourly chart highlights the past four weeks.
As illustrated, the S&P has extended its downturn from recent record highs.
Delving deeper, notable support matches the breakout point (4,257) and the 50-day moving average, currently 4,240.
Monday’s early session low (4,239.8) has matched the 50-day moving average.
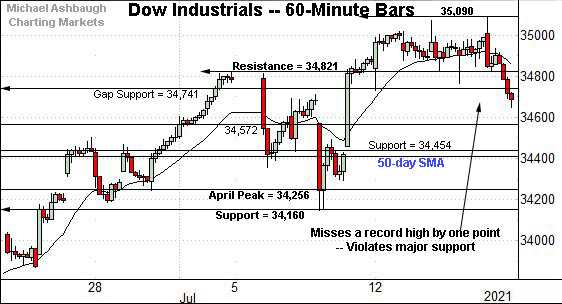
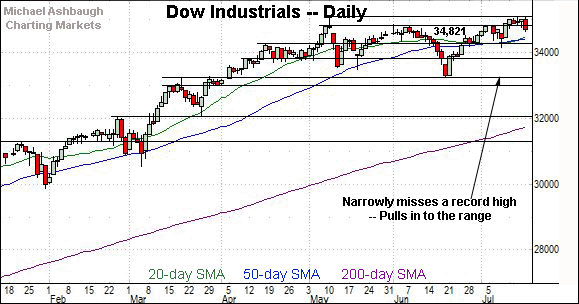
Meanwhile, the Dow Jones Industrial Average has pulled into its range amid a failed technical test.
Recall last week’s high (35,090) registered about one point under the Dow’s absolute record peak (35,091.56), established May 10.
Delving deeper, the 50-day moving average, currently 34,384, is followed by major support (34,160) roughly matching the July low (34,145).
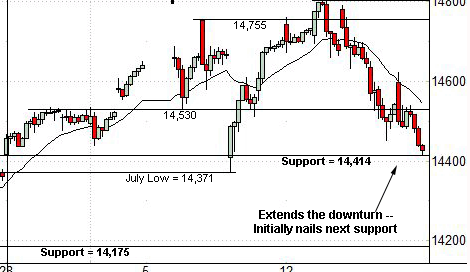
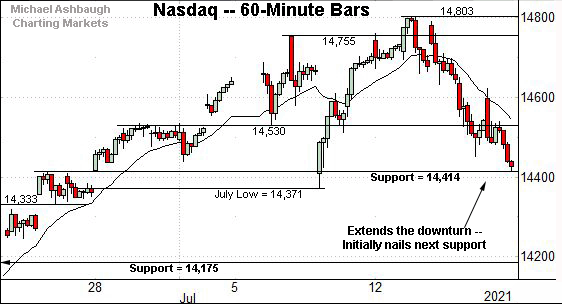
Against this backdrop, the Nasdaq Composite has also extended its pullback.
Amid the downturn, last week’s low (14,413) matched familiar near-term support (14,414), detailed previously.
Delving deeper, major support matches the Nasdaq’s breakout point (14,175), also detailed below.
Widening the view to six months adds perspective.
On this wider view, the Nasdaq has ventured under its 20-day moving average, currently 14,496, raising the flag to a near-term trend shift.
Delving deeper, familiar major support spans from 14,175 to 14,211.
Monday’s early session low (14,178) has registered nearby.
Looking elsewhere, the Dow Jones Industrial Average has pulled in to its range amid a failed breakout attempt.
Tactically, the 50-day moving average, currently 34,384, is followed by the 33,800 area. A closing violation would raise a question mark.
Delving deeper, likely last-ditch support matches the June low (33,271). An eventual violation would mark a material “lower low” to punctuate a bearish double top.
Meanwhile, the S&P 500 has extended a pullback from record highs.
Tactically, the breakout points — at 4,238 and 4,257 — closely match the 50-day moving average, currently 4,240.
The bigger picture
The major U.S. benchmarks are firmly on the defensive early Monday, pressured as potentially consequential technical tests take shape.
On a headline basis, the S&P 500 has challenged its 50-day moving average, currently 4,240, while the Nasdaq Composite retests its breakout point (14,175).
Monday’s early session lows — S&P 4,239.8 and Nasdaq 14,178 — have closely matched support.
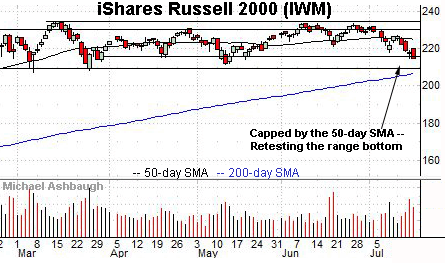
Moving to the small-caps, the iShares Russell 2000 ETF has extended its downturn, pressured amid increased volume.
Tactically, deeper support, circa 209.30, is followed by the 200-day moving average, currently 206.78.
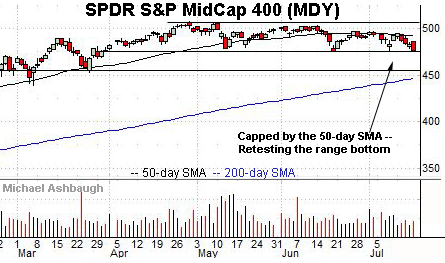
Meanwhile, the SPDR S&P MidCap 400 ETF is challenging three-month lows.
Here again, the prevailing downturn punctuates a failed test of the 50-day moving average.
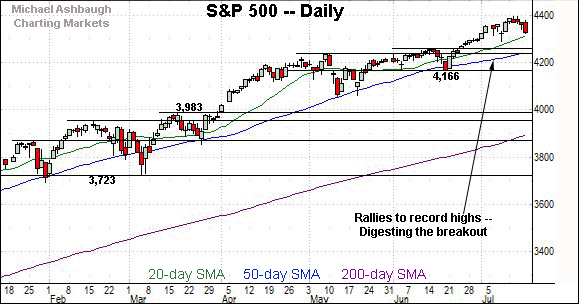
Returning to the S&P 500, the index concluded last week amid respectable selling pressure. Specifically, NYSE advancing volume surpassed declining volume by a greater than 5-to-1 margin. (Notable, though not off-the-charts, selling pressure.)
More immediately, Monday’s early downside follow-through places familiar support under siege.
Tactically, the S&P’s breakout points — around 4,257 and 4,238 — closely match the 50-day moving average, currently 4,240.
Monday’s early session low (4,239.8) has effectively matched the 50-day moving average.
Delving deeper, more important support matches the June closing low (4,166). As detailed repeatedly, an eventual violation would mark a “lower low” — combined with a violation of the 50-day moving average — likely raising a technical caution flag.
As always, it’s not just what the markets do, it’s how they do it.
All told, the S&P 500’s intermediate-term bias remains bullish — based on today’s backdrop — though notable technical tests are underway. Monday’s close, and the next several sessions, will likely add color.
Watch List
Drilling down further, the U.S sub-sector backdrop continues to soften amid narrowing market leadership. Four groups exemplify the prevailing backdrop:
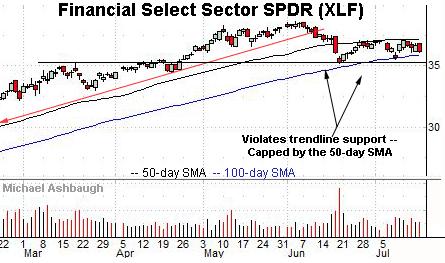
To start, the Financial Select Sector SPDR remains tenuously positioned.
Technically, the group has registered lackluster rallies from the June and July lows, stalling near the 50-day moving average, currently 37.06.
More immediately, the prevailing downturn positions the group for a potentially consequential retest of the June low (35.18).
As detailed previously, an eventual violation would mark a material “lower low” confirming the group’s June trend shift. (Also see the July 7 review.)
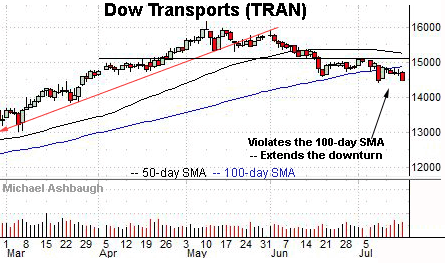
Meanwhile, the Dow Transports continue to press three-month lows.
Against this backdrop, the group has sustained a recent violation of the 100-day moving average, asserting a posture lower for the first time since June 2020.
Recall the July downturn punctuates a material “lower low” confirming the transports’ prevailing downtrend.
Tactically, a reversal atop the 100-day moving average, currently 14,877, and the July range top (15,081) would place the transports on firmer technical ground. (Also see the July 9 review.)
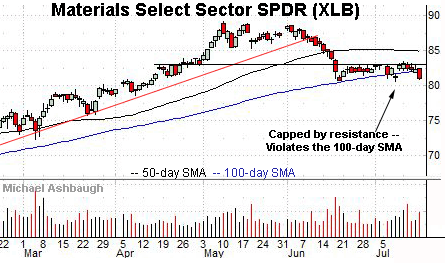
Looking elsewhere, the Materials Select Sector SPDR has violated its 100-day moving average, notching its first closes lower since May 2020.
Delving slightly deeper, notable support support spans from 80.67 to 80.74, levels matching the June and July lows.
The group has ventured under support early Monday. A closing violation would confirm the group’s intermediate-term downtrend. (Also see the July 9 review.)
Similarly, the SPDR S&P Metals and Mining ETF has reached a key technical test.
As illustrated, the group has ventured under its breakout point, circa 41.20, tagging a nominal 10-week low.
Downside follow-through would confirm the group’s bearish intermediate-term bias, initially signaled with the mid-June strong-volume downdraft.
Summing up the U.S. sub-sector backdrop
Combined, the groups detailed exemplify that the former reflation trade is likely finished. (Put differently, the rotation toward cyclicals, and away from growth, as the U.S. economy re-opened, is likely over.)
Persistently narrowing leadership — increasingly reliant on the FANG names — places the broad-market uptrend on fragile footing. (Also see the July 9 review.)
Beyond the U.S. — Silver and Japan
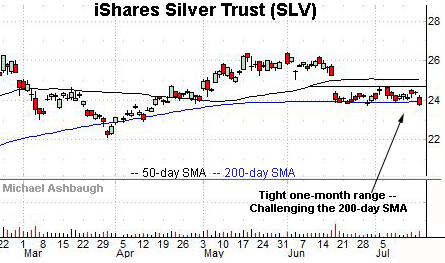
Most recently profiled July 14, the iShares Silver Trust remains tenuously positioned.
As illustrated, the shares have ventured under the 200-day moving average, currently 23.95, notching a three-month closing low.
The downturn opens the path to potentially swift downside follow-through. Recall that trading ranges are more frequently exited in the direction in which they were entered.
Finally, the iShares MSCI Japan ETF has reached a potentially consequential technical test.
As illustrated, the shares are pressing major support (67.00) closely matching the 200-day moving average, currently 66.84. The shares have not closed under the 200-day across nearly one year, since early-August 2020.
Delving slightly deeper, the July low (66.38) marks likely last-ditch support.
More broadly, the prevailing downturn punctuates a prolonged five-month range, laying the groundwork for potentially material downside follow-through on a violation.

