Charting a bull-flag breakout attempt, Dow industrials narrowly miss record high
Focus: 10-year yield approaches 200-day average, Energy sector violates major support, China reaches key technical test, TNX, XLE, SBUX, PEP, NOK, FXI
U.S. stocks are lower early Friday, pressured after a mixed batch of economic data.
Against this backdrop, the Dow Jones Industrial Average has topped early Friday within one point of its all-time high (35,091) — and selling pressure has surfaced — while the S&P 500 and Nasdaq Composite continue to digest their respective July breakouts.
Editor’s Note: As always, updates can be directly accessed at chartingmarkets.substack.com.
Before detailing the U.S. markets’ wider view, the S&P 500’s hourly chart highlights the past four weeks.
As illustrated, the S&P has pulled in modestly from recent record highs.
Tactically, the former breakout point (4,361) remains an inflection point.
Delving deeper, near-term support (4,314) has underpinned the S&P across about two weeks on a closing basis.
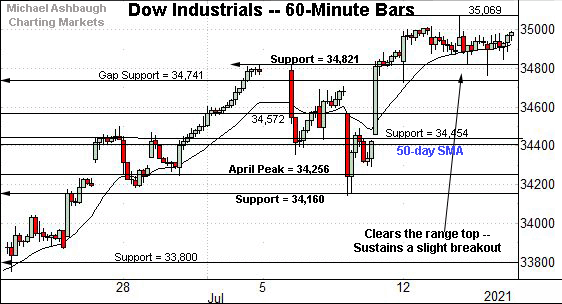
Meanwhile, the Dow Jones Industrial Average has strengthened on the margin versus the other benchmarks.
The prevailing flag-like pattern places record territory within view.
The Dow’s absolute record peak (35,091.56) — established May 10 — remains just overhead. (Also see the daily chart.)
Conversely, the breakout point (34,820) has effectively underpinned the prevailing pattern. Constructive price action.
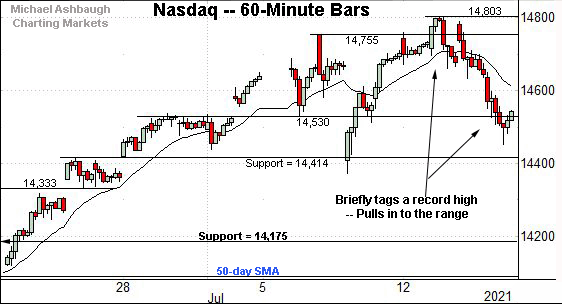
Against this backdrop, the Nasdaq Composite has extended a pullback amid comparably jagged July price action.
Tactically, near-term support (14,414) is closely followed by an inflection point matching the July low (14,371).
Widening the view to six months adds perspective.
On this wider view, the Nasdaq continues to digest its summer breakout.
Tactically, the 20-day moving average, currently 14,490, is followed by major support spanning from 14,175 to 14,211.
The Nasdaq has trended atop the 20-day moving average across nearly two months — since mid-May. The latest retest is underway early Friday.
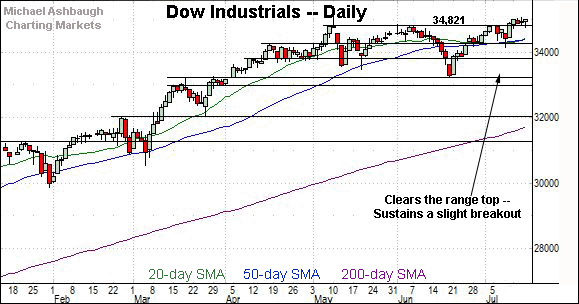
Looking elsewhere, the Dow Jones Industrial Average has sustained a break to two-month highs.
The prevailing upturn places the Dow’s absolute record peak (35,091.56) within view.
To reiterate, Friday’s early session high (35,090.01) has registered nearby.
Conversely, the former range top (34,820) is followed by the 50-day moving average, currently 34,399, and support closely matching the July low (34,145).
Meanwhile, the S&P 500 is digesting a comparably more decisive July breakout.
The week-to-date peak (4,393.68) — also the S&P’s absolute record peak — has registered within view of the 4,400 mark.
The bigger picture
Collectively, the major U.S. benchmarks are acting well enough technically, though narrowing participation remains a potential overhang.
On a headline basis, the S&P 500 and Nasdaq Composite have registered record highs this week.
Meanwhile, the Dow Jones Industrial Average has topped early Friday just one point from its all-time high (35,091) and intraday selling pressure has surfaced.
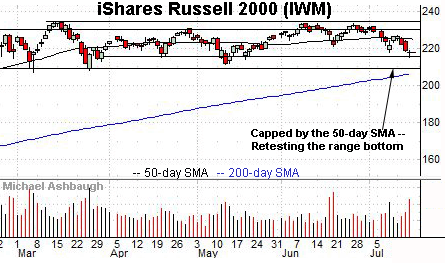
Moving to the small-caps, the iShares Russell 2000 ETF has notched a 3.9% week-to-date downturn through Thursday’s close.
The pullback has been punctuated by a nearly two-month low, the lowest print since May 19.
Tactically, the 50-day moving average, currently 225.08, remains an overhead sticking point.
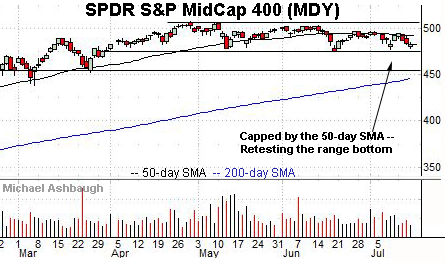
Meanwhile, the SPDR S&P MidCap 400 ETF is approaching a three-month range bottom. The June low (475.11) matches notable support.
Here again, the 50-day moving average, currently 492.40, has marked a recent hurdle.
More broadly, the tandem small- and mid-cap sluggishness exemplifies a narrowing summer rally.
The MDY has registered a 2.1% week-to-date downturn.
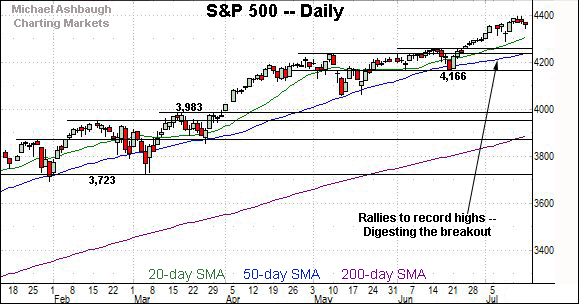
Returning to the S&P 500, its six-month backdrop remains constructive.
The index continues to digest its sharp two standard deviation breakout, registered to start the third quarter, across July’s first two sessions.
The “expected” consolidation phase remains underway.
Tactically, near-term support (4,314) closely matches the 20-day moving average, currently 4,310, and the S&P’s former projected target, also 4,310.
This is followed by the breakout points — around 4,257 and 4,238 — and the ascending 50-day moving average, currently 4,240.
Delving deeper, more significant support matches the June closing low (4,166). An eventual violation of the 4,166 area would mark a “lower low” — combined with a violation of the 50-day moving average — likely raising a technical caution flag.
Beyond specific levels, the S&P 500’s intermediate-term bias remains comfortably bullish, based on today’s backdrop, though amid increasingly narrow market leadership.
Watch List
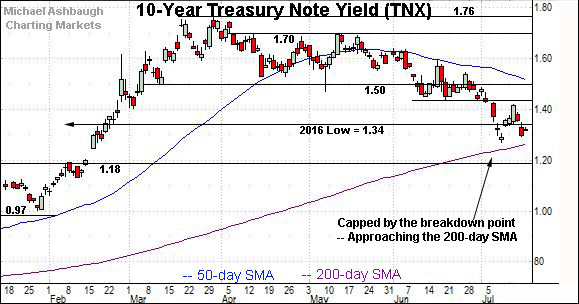
Drilling down further, the 10-year Treasury note yield remains under pressure.
Recall the yield started July with a downdraft, plunging to four-month lows.
The subsequent bounce has been capped by the breakdown point (1.44) preserving a downtrend from the March peak.
Delving deeper, the 200-day moving average, currently 1.26, is increasingly within view. The yield has not traded under the 200-day since early November.
Tactically, an eventual violation of the 200-day moving average (1.26) and the July low (1.27) would signal a primary trend shift.
Conversely, a reversal atop the breakdown point (1.44) and the 50-day moving average, currently 1.52, would mark a step toward stabilization. (Recall the yield’s mid-June peak precisely matched the 50-day moving average, the day of the Federal Reserve’s June policy directive.)
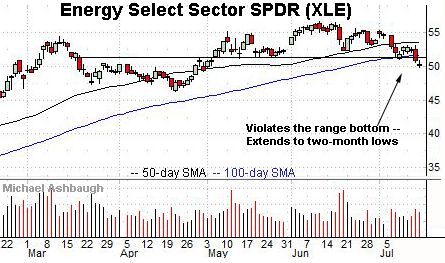
Moving to U.S. sectors, the Energy Select Sector SPDR’s backdrop exemplifies a market headwind. Namely, sector participation continues to narrow amid a market rally increasingly dependent on the so-called FANG names.
As illustrated, the group has has tagged two-month lows, violating support closely matching the 100-day moving average.
The downturn punctuates an 11.6% pullback from the June peak, across just five weeks.
Tactically, a reversal atop the breakdown point (51.40) would place the brakes on bearish momentum.
Incremental follow-through atop the 50-day moving average — a recent sticking point — would incrementally strengthen the bull case.
Moving to specific names, Starbucks Corp. is a well positioned large-cap name. (Yield = 1.5%.)
Earlier this week, the shares rallied to record highs, clearing resistance matching the April peak.
The subsequent pullback has been flat, underpinned by the breakout point (117.75). Constructive price action.
Delving deeper, the former range top (114.60) is closely followed by the 50-day moving average. A sustained posture atop this area signals a bullish bias.
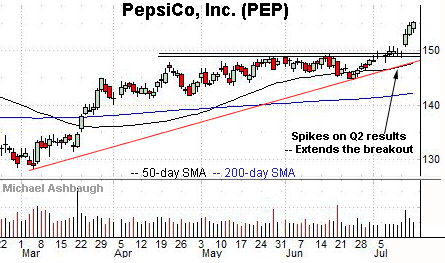
PepsiCo, Inc. is another well positioned large-cap name. (Yield = 2.8%.)
As illustrated, the shares have recently knifed to all-time highs, rising after the company’s strong second-quarter results.
The upturn marks a bullish two standard deviation breakout, encompassing three straight closes atop the 20-day volatility bands. (Unusual strength for a name like Pepsi, though the shares registered a similar mid-March breakout.)
Though near-term extended, and due to consolidate, the shares are attractive on a pullback. Tactically, gap support (150.75) is followed by the firmer breakout point (149.30).
Nokia Corp. is a large-cap Finland-based telecom-equipment maker and contributor to the 5G buildout.
As illustrated, the shares have recently gapped to five-month highs, rising after the company announced it will upwardly revise its full-year outlook.
The ensuing pullback has been fueled by decreased volume, placing the shares near the breakout point (5.65) and 4.3% under the July peak.
Tactically, a sustained posture atop gap support (5.47) signals a bullish bias.
Finally, the iShares China Large-Cap ETF has reached a notable test.
As illustrated, the shares have reversed from nine-month lows, rising amid recently decreased volume.
Tactically, an eventual close atop the breakdown point (44.88) would mark technical progress. (Consecutive session highs have registered within one cent.)
More broadly, follow-through atop the 50-day moving average and trendline resistance would more firmly strengthen the bull case.
The prevailing retest of the breakdown point (44.88) will likely add color.


