Charting a strong July start, S&P 500 clears 20-day volatility bands
Focus: 10-year yield ventures under key level, Amazon's breakout, TNX, XLF, AMZN, V, SPWR
U.S. stocks are mixed early Wednesday, vacillating ahead of the release of the latest Federal Reserve meeting minutes.
Against this backdrop, the S&P 500 has confirmed its uptrend, staging a statistically unusual two standard deviation breakout to start July.
Editor’s Note: As always, updates can be directly accessed at chartingmarkets.substack.com. Your smartphone can also access updates at the same address.
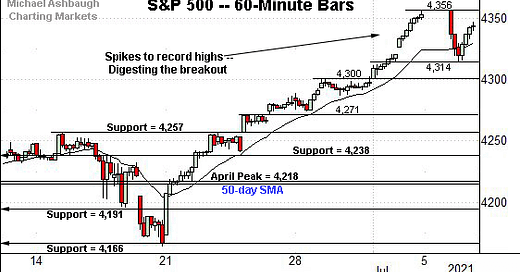
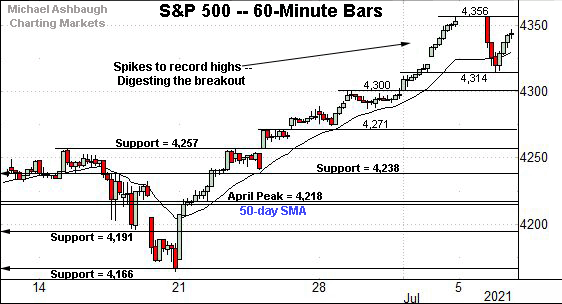
Before detailing the U.S. markets’ wider view, the S&P 500’s hourly chart highlights the past four weeks.
As illustrated, the S&P is off to a strong third-quarter start, extending its summer breakout.
Tactically, initial support (4,314) roughly matches the S&P’s former projected target (4,310).
Delving deeper, near-term support (4,271) is followed by the firmer breakout point (4,257).
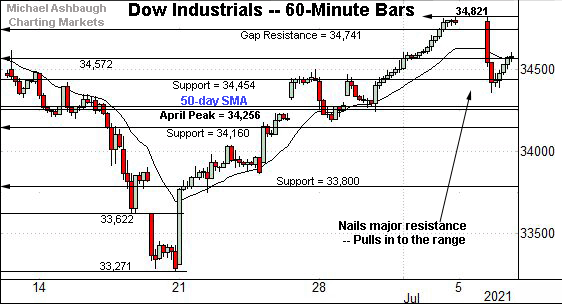
Meanwhile, the Dow Jones Industrial Average has not reached record territory.
Still, the index has sustained a recent break atop the 50-day moving average, currently 34,280, and the former breakdown point (34,454).
Wednesday’s early session low (34,450) has roughly matched the latter.
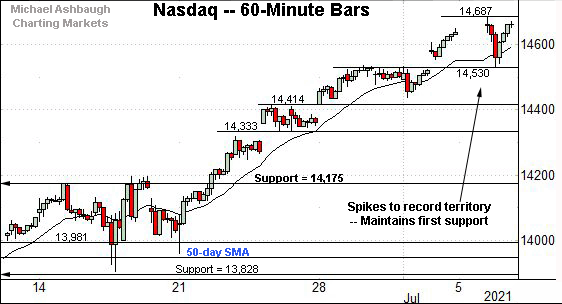
Against this backdrop, the Nasdaq Composite continues to outperform.
Tactically, near-term floors — around 14,530 and 14,414 — are followed by firmer support better illustrated below.
Widening the view to six months adds perspective.
On this wider view, the Nasdaq has taken flight, extending its break from a well-defined double bottom. Tactically, the breakout point — broadly the 14,175-to-14,211 area — pivots to major support.
Conversely, an intermediate-term target continues to project to the 15,420 area.
Looking elsewhere, the Dow Jones Industrial Average remains range-bound.
Tactically, consider that last week’s high (34,821.93) closely matched the early-June peak (34,820.91). This area marks a hurdle.
On further strength, the Dow’s record close (34,777.76) and absolute record peak (35.091.56) remain slightly more distant.
Meanwhile, the S&P 500’s breakout accelerated to start July.
In the process, the index has registered an unusual two standard deviation breakout, encompassing consecutive closes atop the 20-day Bollinger bands. (The Nasdaq has not registered a two standard deviation breakout amid grinding-higher price action.)
The bigger picture
As detailed above, the major U.S. benchmarks are off to a constructive third-quarter start.
On a headline basis, the S&P 500 and Nasdaq Composite have registered respectable breaks to record territory.
Meanwhile, the Dow Jones Industrial Average remains range-bound amid a broad-market rally that increasingly relies on the so-called FANG names. The prevailing U.S. sector backdrop does not currently scream “raging bull.”
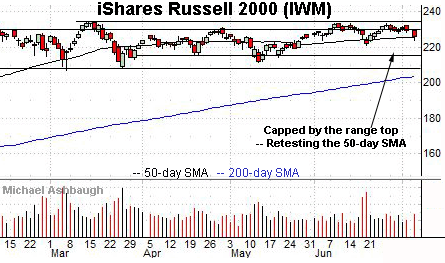
Moving to the small-caps, the iShares Russell 2000 ETF has pulled in from its range top.
Its latest retest of the 50-day moving average, currently 225.65, remains underway.
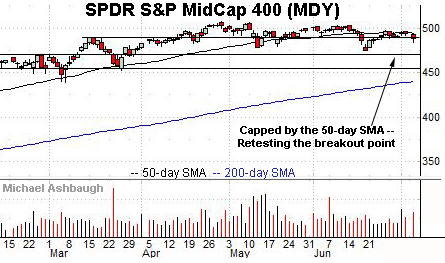
Meanwhile, the SPDR S&P MidCap 400 ETF has balked at its 50-day moving average, currently 494.25.
Combined, the small- and mid-caps have both pulled in amid a volume uptick, another sign of narrowing participation.
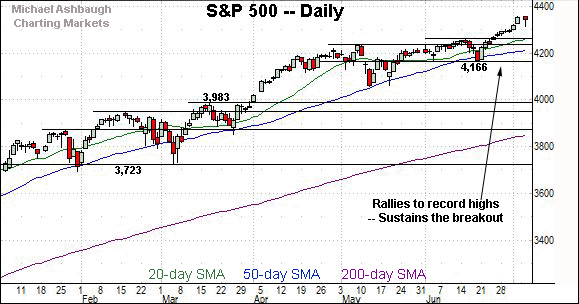
Placing a finer point on the S&P 500, the index is digesting its summer breakout.
To reiterate, initial support (4,314) roughly matches the S&P’s former projected target (4,310).
Delving deeper, near-term support (4,271) is followed by the firmer breakout point (4,257).
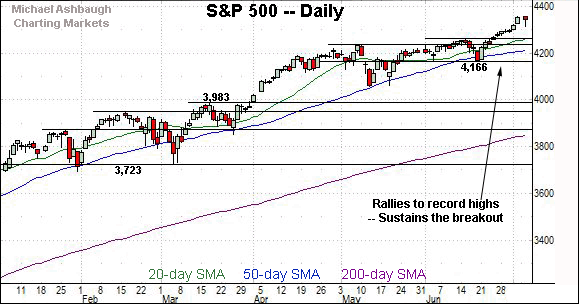
More broadly, the S&P has registered a respectable 2.7% breakout, confirming its primary uptrend.
Tactically, the S&P’s first notable floors — around 4,257 and 4,238 — are closely followed by the 50-day moving average, currently 4,214.
Delving deeper, the June closing low (4,166) marks a potentially significant floor.
As detailed previously, an eventual violation of the 4,166 area would mark a “lower low” — combined with a violation of the 50-day moving average — raising a technical question mark.
Beyond specific levels, the S&P 500 has confirmed its uptrend — amid a bullish two standard deviation breakout — and its intermediate-term bias remains bullish. Narrowing sub-sector participation remains a potential concern.
Watch List
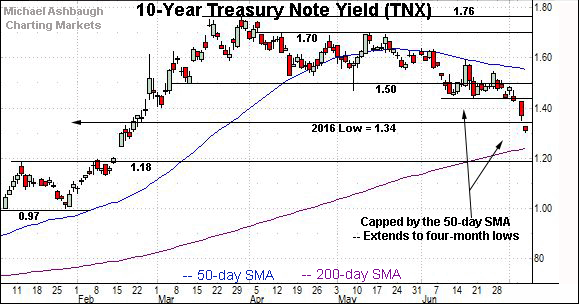
Drilling down further, the 10-year Treasury note yield has started July with a downdraft.
In the process, the yield has ventured under a truly longer-term inflection point matching the 2016 low (1.34).
Delving deeper, the 200-day moving average, currently 1.24, is closely followed by an inflection point in the 1.18-to-1.20 area. Eventual follow-through under this area would signal a yield-bearish longer-term bias.
Conversely, a swift reversal atop the yield’s breakdown point (1.44) — which currently looks unlikely — would mark a step toward stabilization.
Slightly more broadly, recall the yield’s mid-June peak precisely matched the 50-day moving average, the day of the Federal Reserve’s most recent policy directive. The 50-day remains a useful intermediate-term inflection point. (Also see the June 23 review.)
Meanwhile, the Financial Select Sector SPDR continues to lag behind, pressured at least partly amid easing Treasury yields.
Technically, the group registered a corrective bounce from the June low, ultimately stalling near the breakdown point (36.55) and the 50-day moving average, currently 37.12.
The prevailing downturn from the 50-day has been fueled by a volume uptick.
Tactically, the pullback positions the group for a potentially consequential retest of the June low (35.18). An eventual violation would mark a material “lower low” confirming the group’s recent trend shift. (Also see the June 30 review.)
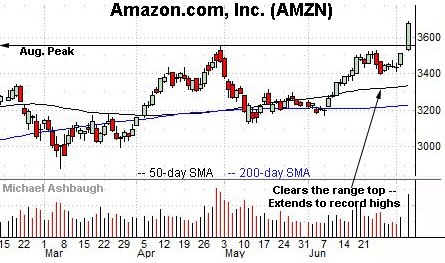
Moving to specific names, Amazon.com has broken out, rising at least partly amid the tailwind of easing Treasury yields.
(Recall the prevailing broad-market leg higher has registered amid narrowing sector participation, increasingly concentrated in the so-called FANG names.)
Technically, Amazon has knifed to record highs, clearing major resistance matching the April peak (3,554.00) and August peak (3,552.25). This area pivots to well-defined support.
More broadly, Amazon.com is well positioned on the five-year chart, rising from a one-year continuation pattern effectively spanning the pandemic. A longer-term target projects to the 4,150 area.
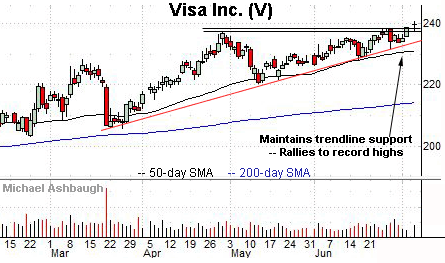
Visa, Inc. is a well positioned Dow 30 component.
As illustrated, the shares have rallied to record territory, rising from an ascending triangle hinged to the March low.
Tactically, the breakout point (238.50) is closely followed by trendline support. The prevailing rally attempt is intact barring a violation.
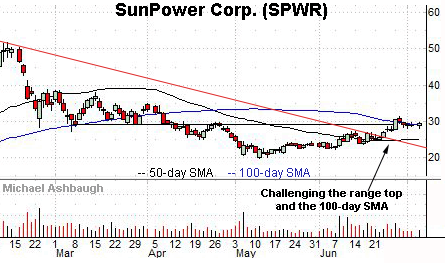
Finally, SunPower Corp. is a large-cap name coming to life.
Technically, the shares are challenging a nearly three-month range top (29.75) and the 100-day moving average, currently 28.90.
Underlying the upturn, its relative strength index (not illustrated) has recently tagged its best levels since January, improving the chances of eventual follow-through.
Tactically, a breakout attempt is in play barring a violation of near-term support, circa 28.10.

