Charting a bull-trend pullback, S&P 500 digests July breakout
Focus: Health care sector sustains break to record territory, Apple and McDonald's challenge all-time highs, Silver's precarious posture, XLV, AAPL, MCD, PANW, SHOP, SLV
U.S. stocks are mixed early Wednesday, vacillating after a generally strong batch of quarterly earnings reports.
Against this backdrop, the S&P 500 and Nasdaq Composite continue to consolidate early-week breaks to record territory.
Editor’s Note: As always, updates can be directly accessed at chartingmarkets.substack.com.
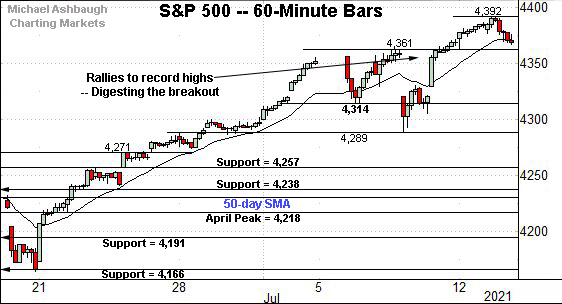
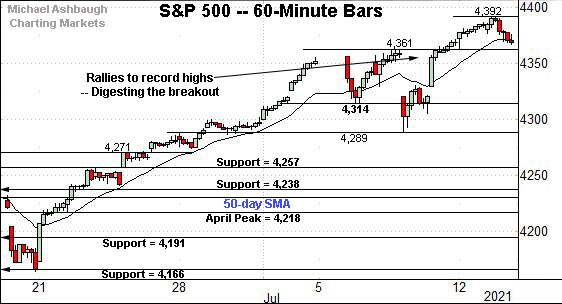
Before detailing the U.S. markets’ wider view, the S&P 500’s hourly chart highlights the past four weeks.
As illustrated, the S&P is digesting its latest break to record territory.
Tactically, the breakout point (4,361) marks first support.
Delving deeper, the prevailing upturn punctuates a successful test of near-term support (4,314) on a closing basis.
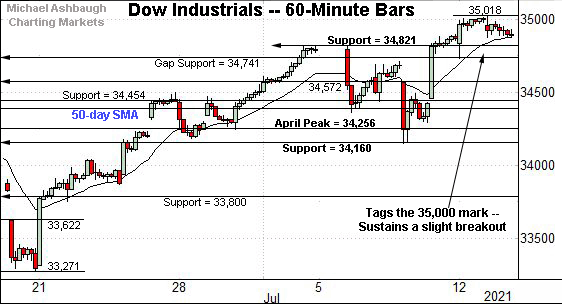
Meanwhile, the Dow Jones Industrial Average has sustained a slight break to two-month highs.
The Dow’s absolute record peak (35,091.56) — established May 10 — remains just overhead. (Also see the daily chart.)
Conversely, the breakout point (34,820) marks a well-defined floor.
Slightly more broadly, the prevailing upturn originates from support matching the former range bottom (34,160).
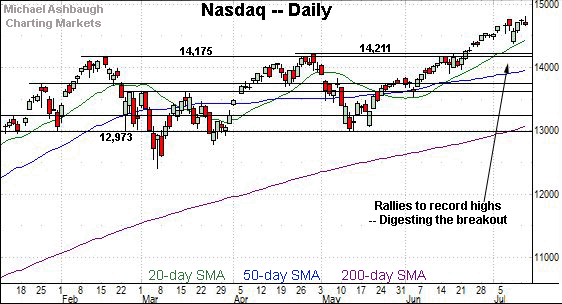
Against this backdrop, the Nasdaq Composite has briefly tagged its latest record high, and pulled in to the range.
In the process, the index has ventured under the early-July peak (14,755) unlike the other benchmarks.
Widening the view to six months adds perspective.
On this wider view, the Nasdaq continues to digest its summer breakout.
Tactically, the 20-day moving average, currently 14,454, is followed by major support spanning from 14,175 to 14,211.
Conversely, an intermediate-term target continues to project to the 15,420 area.
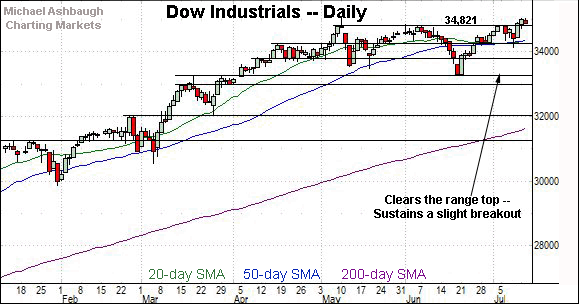
Looking elsewhere, the Dow Jones Industrial Average has rallied to two-month highs.
The prevailing upturn places the Dow’s absolute record peak (35,091.56) within view.
More broadly, the slight breakout punctuates a double bottom — the W formation — defined by the May and June lows. An intermediate-term target projects to the 36,350 area.
Conversely, the former range top (34,820) is followed by the 50-day moving average, currently 34,368, and support closely matching the July low (34,145).
Meanwhile, the S&P 500 is digesting its recent breakout amid still muted selling pressure.
As detailed previously, the prevailing flag-like pattern punctuates an early-July two standard deviation breakout, encompassing consecutive closes atop the 20-day Bollinger bands. Recent sideways price action marks the “expected” consolidation phase.
The bigger picture
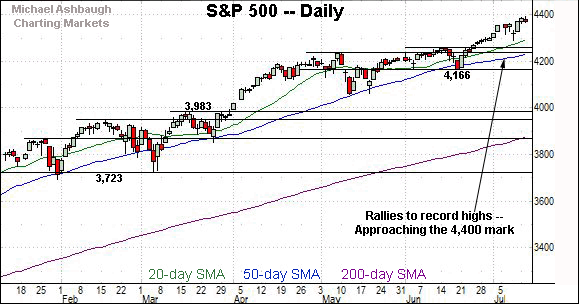
As detailed above, the major U.S. benchmarks continue to act well technically.
On a headline basis, each big three benchmark notched its latest record close to start this week, and the subsequent selling pressure remains flat, consistent with recent form.
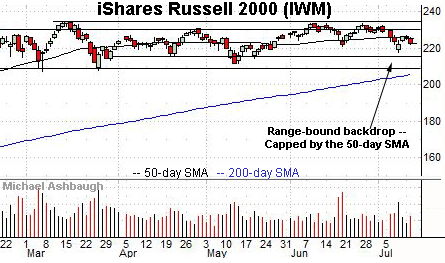
Moving to the small-caps, the iShares Russell 2000 ETF remains range-bound.
Within the range, the 50-day moving average, currently 225.30, has capped recent price action.
Placing a finer point on the S&P 500, the index continues to trend higher.
In fact, the index has trended atop its 20-hour moving average across nearly one month with the exception of the July 8 price action. (See the gap lower, and subsequent gap atop the 20-hour moving average, the next session.)
A persistent uptrend is currently in play.
Tactically, the former range top (4,361) is followed by near-term support (4,314), an area roughly matching the S&P’s former projected target (4,310).
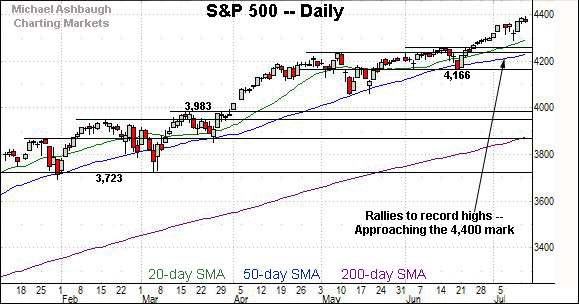
Returning to the six-month view, the S&P 500 remains in grinding-higher consolidation mode.
This week’s slight follow-through punctuates a flag pattern — hinged to the early-July breakout — a move encompassing consecutive closes atop the 20-day Bollinger bands.
Tactically, near-term support (4,314) is followed by the breakout points — around 4,257 and 4,238 — and the ascending 50-day moving average, currently 4,232.
Delving deeper, more significant support matches the June closing low (4,166). Recall that an eventual violation of the 4,166 area would mark a “lower low” — combined with a violation of the 50-day moving average — raising a technical question mark.
Beyond technical levels, the S&P 500 seems to be working off its near-term extended posture — following a two standard deviation breakout — amid a still comfortably bullish intermediate-term backdrop.
Watch List
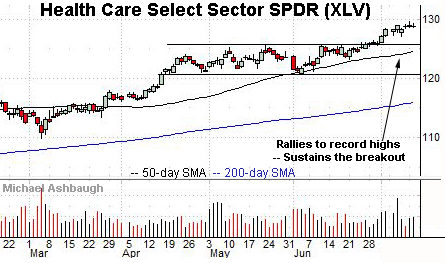
Drilling down further, the chart above illustrates an under-heralded contributor to the broad-market rally. (The prevailing rally could be characterized as FANG + health care, on the margin.)
Earlier this month, the Health Care Select Sector SPDR knifed to record highs, clearing resistance matching the May peak.
The subsequent flag-like pattern signals still muted selling pressure, likely laying the groundwork for incremental follow-through.
Tactically, the 50-day moving average is rising toward the breakout point (125.40). A sustained posture higher signals a bullish bias.
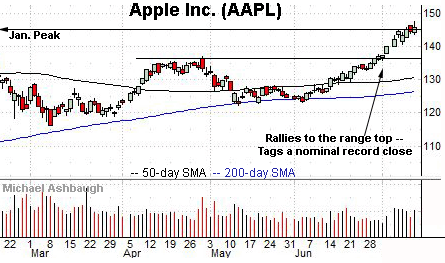
Moving to specific names, Apple, Inc. is a well positioned Dow 30 component. The shares are higher early Wednesday, rising after an analyst upgrade, and amid reports the company is seeking to increase iPhone production this year.
Technically, the shares have rallied to the range top, rising to tag a nominal record close.
The July upturn has been fueled by a sustained volume increase, improving the chances of more decisive follow-through. (Also see the lighter-volume modest single-day downturn.)
Tactically, a breakout attempt is in play barring a violation of near-term support, circa 140.70.
More broadly, the prevailing upturn originates from the 200-day moving average, near the May and June lows.
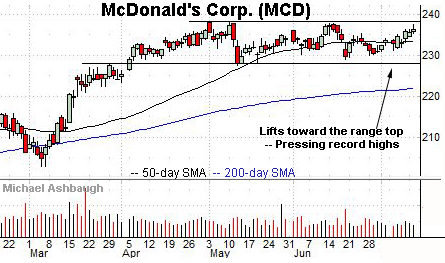
Looking elsewhere, McDonald’s Corp. is another well positioned Dow 30 component. (Yield = 2.2%.)
As illustrated, the shares have rallied toward the range top (238.18), within striking distance of record highs.
The prevailing upturn punctuates an orderly three-month range hinged to the steep March rally.
Tactically, the 50-day moving average (233.25) effectively bisects the range, and offers an area to work against. A breakout attempt is in play barring a violation.
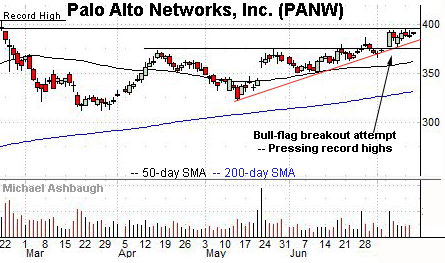
Palo Alto Networks, Inc. is a large-cap cybersecurity name.
As illustrated, the shares have asserted a flag pattern, digesting an early-July strong-volume breakout. The prevailing upturn places record highs under siege.
Tactically, a breakout attempt is in play barring a violation of trendline support and the slightly deeper range bottom (377.70).
Shopify, Inc. is a well positioned large-cap name.
Technically, the shares have asserted an orderly one-month range, digesting the sharp mid-June strong-volume rally.
The sideways price action signals muted selling pressure, positioning the shares to build on the June spike. A sustained posture atop the range bottom, circa 1,452, signals a bullish bias.
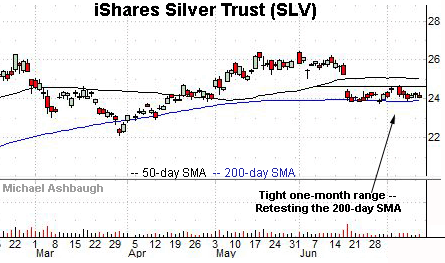
Finally, the iShares Silver Trust is tenuously positioned.
As illustrated, the shares have asserted a tight one-month range, digesting the mid-June gap lower after the Federal Reserve’s policy statement.
Trading ranges are more frequently exited in the direction in which they were entered. In this case, that would point to a more likely break lower.
Tactically, a violation of the 200-day moving average, currently 23.92, would open the path to downside follow-through.
Conversely, a rally above the range top (24.69), the 50-day moving average (25.05) and the top of the gap (25.25) would strengthen the bull case.


