Charting successful technical tests: S&P 500, Nasdaq maintain first support
Focus: U.S. sector participation narrows further, Transports violate key level, TRAN, XLB, XME, QQQ
U.S. stocks are firmly higher early Friday, rising as Treasury yields show signs of stabilization.
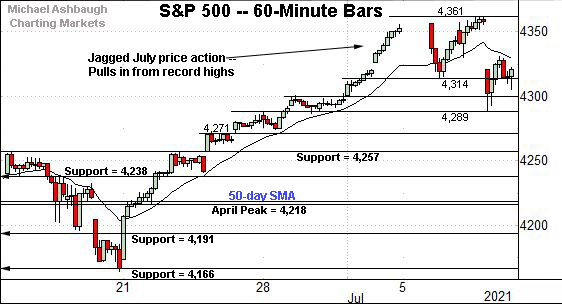
The early upturn punctuates successful tests of first support for the S&P 500 and Nasdaq Composite — the S&P 4,314 and Nasdaq 14,530 areas.
Editor’s Note: As always, updates can be directly accessed at chartingmarkets.substack.com. Your smartphone can also access updates at the same address.
Before detailing the U.S. markets’ wider view, the S&P 500’s hourly chart highlights the past four weeks.
As illustrated, the S&P has whipsawed amid jagged July price action.
Still, the prevailing downturn has been underpinned by near-term support (4,314) an area roughly matching the S&P’s former projected target (4,310). Limited damage has been inflicted despite Thursday’s respectable gap lower.
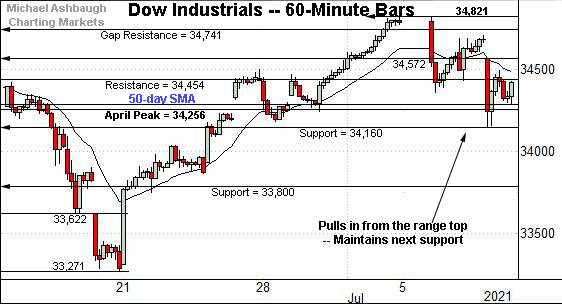
Meanwhile, the Dow Jones Industrial Average continues to lag behind the other benchmarks.
Nonetheless, the prevailing downturn has been underpinned by the 50-day moving average, currently 34,312, and the former range bottom (34,160).
The week-to-date-low (34,145) has registered nearby.
(On a granular note, Thursday’s session high (34,569) closely matched former gap resistance (34,572).)
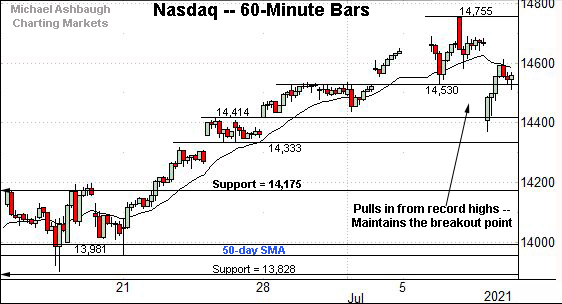
True to recent form, the Nasdaq Composite remains the strongest major benchmark.
Like the S&P, the Nasdaq has maintained near-term support (14,530) on a closing basis. This area effectively matches its near-term breakout point.
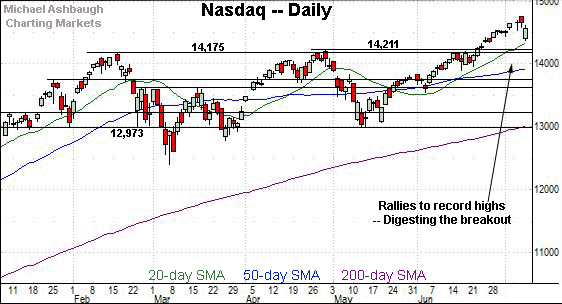
Widening the view to six months adds perspective.
On this wider view, the Nasdaq is digesting a decisive break to record territory.
Tactically, the 20-day moving average, currently 14,360, is followed by major support in the 14,175-to-14,211 area.
More broadly, the Nasdaq’s intermediate-term bias remains comfortably bullish.
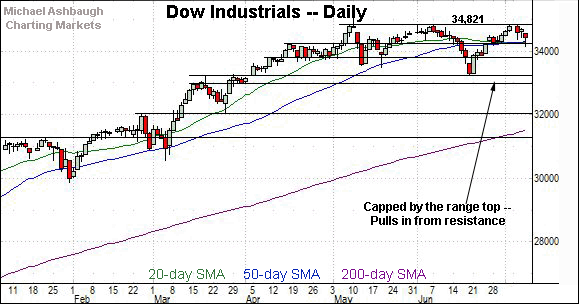
Looking elsewhere, the Dow Jones Industrial Average has pulled in from its range top (34,821), an area defining notable resistance detailed previously.
On further strength, the Dow’s record close (34,777.76) and absolute record peak (35.091.56) remain slightly more distant.
Conversely, the downturn has been underpinned by the 50-day moving average, currently 34,312, and the former range bottom (34,160). (Also see the hourly chart.)
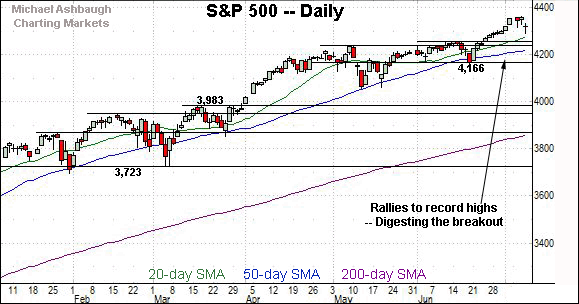
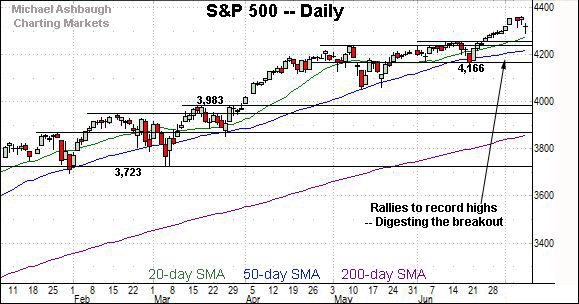
Meanwhile, the S&P 500 is digesting a respectable break to record territory.
Recall the early-July spike marked a two standard deviation breakout, encompassing consecutive closes atop the 20-day Bollinger bands.
The bigger picture
Collectively, the major U.S. benchmarks seem to have weathered Thursday’s initially aggressive downturn from recent highs.
In the process, the S&P 500 and Nasdaq Composite have maintained first support — the S&P 4,314 and Nasdaq 14,530 areas — on a closing basis.
Meanwhile, the comparably lagging Dow industrials have maintained a posture atop the 50-day moving average. (See the hourly charts.)
Moving to the small-caps, the iShares Russell 2000 ETF remains range-bound.
The prevailing downturn places the small-cap benchmark back under its 50-day moving average, currently 225.48.
Note the 50-day’s flattish slope signals an absence of trend, consistent with a range-bound backdrop.
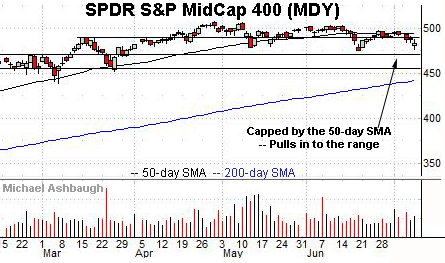
Meanwhile, the SPDR S&P MidCap 400 ETF has extended a pullback from its 50-day moving average, currently 493.62.
Here again, the MDY remains range-bound in the broad sweep.
Placing a finer point on the S&P 500, the index continues to digest its summer breakout.
Its initial break from the former range top (4,257) registered on June 24.
More immediately, the S&P has maintained its first near-term floor (4,314) on a closing basis.
Returning to the six-month view, the S&P has sustained a respectable 2.8% breakout.
Recall the early-July follow-through — also the third-quarter’s first two sessions — punctuated a two standard deviation breakout, encompassing consecutive closes atop the 20-day Bollinger bands.
The subsequent pullback has thus far been orderly, in the broad sweep, and underpinned by first support (4,314). Constructive price action.
On further weakness, firmer floors — around 4,257 and 4,238 — are closely followed by the 50-day moving average, currently 4,221.
Delving deeper, more significant support matches the June closing low (4,166).
As detailed repeatedly, an eventual violation of the 4,166 area would mark a “lower low” — combined with a violation of the 50-day moving average — raising a technical question mark.
Beyond technical levels, the S&P 500 remains near-term extended — following a two standard deviation breakout — and a consolidation phase may be underway. More broadly, the S&P 500’s intermediate-term bias remains bullish, based on today’s backdrop.
Watch List — Charting U.S. sector cross currents
Drilling down further, the U.S sub-sector backdrop has softened to start third quarter. Four groups exemplify the prevailing backdrop:
To start, the Dow Transports have tagged three-month lows.
The downturn places the group under its 100-day moving average for the first time since June 2020.
Moreover, the downturn marks a material “lower low” technically confirming the prevailing downtrend.
Tactically, a reversal atop the 100-day moving average, currently 14,800, and the July range top (15,081) would place the transports on firmer technical ground. (Also see the June 18 review.)
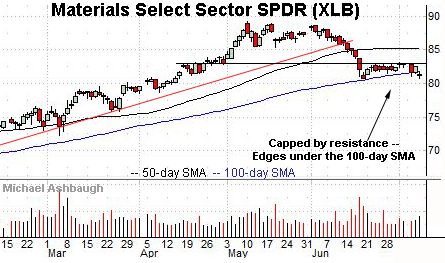
Meanwhile, the Materials Select Sector SPDR has ventured slightly under its 100-day moving average, closing lower for the first time since May 2020.
Still, the group has thus far maintained notable support — the 80.67-to-80.74 area — levels matching the June and July lows. Tactically, an eventual violation would confirm the group’s intermediate-term downtrend.
Conversely, a reversal above the prevailing range top (83.08) would place the group on firmer footing.
Slightly more broadly, the group’s tight three-week range lays the groundwork for potentially swift follow-through — in either direction — once the eventual break registers.
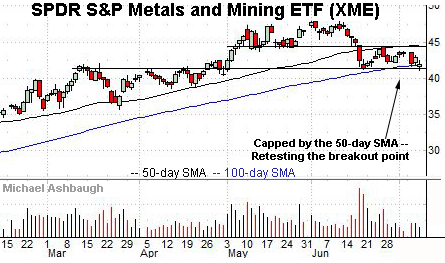
Looking elsewhere, the SPDR S&P Metals and Mining ETF has reached a notable technical test.
Consider that major support matches the breakout point, circa 41.20, and the 100-day moving average, currently 41.92.
An eventual violation would confirm the group’s bearish intermediate-term bias, initially signaled with the mid-June strong-volume downdraft.
Conversely, notable resistance matches the breakdown point, circa 44.40, and the 50-day moving average, currently 44.52. A sustained break higher would signal a bullish technical bias.
Large-cap tech remains resilient
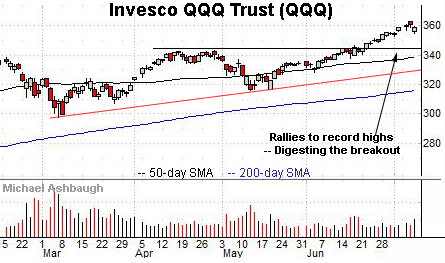
Finally, the Invesco QQQ Trust — a proxy for large-cap technology — remains a familiar pocket of relative strength.
As illustrated, the group’s decisive break to record territory has been punctuated by thus far muted selling pressure.
Tactically, the breakout point marks major support, an area spanning from about 342.50 to 344.50. A sustained posture higher signals a bullish bias.
Summing up the U.S. sector backdrop
Collectively, the groups detailed exemplify a less-than-ideal U.S. sub-sector backdrop. The prevailing re-rotation toward growth and away from value — amid plunging Treasury yields — signals a potential end to the former reflation trade.
Market bulls will point to sources of fuel for the next broad-market leg higher. (If, for instance, the transports and materials would stabilize, and begin to rally.)
Conversely, market bears will point to narrowing participation, a fragile backdrop for the broad-market uptrend.
As it applies to the S&P 500, its intermediate-term bias remains comfortably bullish, based on today’s backdrop, though narrowing leadership presents a potential headwind.


