Charting a corrective bounce, S&P 500 nails 50-day average
Focus: Dow industrials tag the breakdown point (38,560) amid seasonal headwind
Technically speaking, the major U.S. benchmarks have turned lower recent weeks, pressured amid heightened inflation-related concerns.
Against this backdrop, the S&P 500 and Nasdaq Composite have failed recent retests of the 50-day moving average, preserving a bearish intermediate-term technical bias to start May. The charts below add color:
Editor’s Note: As always, updates can be directly accessed at https://chartingmarkets.substack.com.
Before detailing the U.S. markets’ wider view, the S&P 500’s hourly chart highlights the past four weeks.
As illustrated, the S&P 500 has recently tagged two technical levels.
To start, the recent downturn has been underpinned by major support (4,950) an area also detailed on the daily chart. The April low (4,953) registered nearby.
Coversely, the subsequent rally attempt has been capped by the 50-day moving average, currently 5,128, preserving a bearish intermediate-term bias.
Meanwhile, the Dow Jones Industrial Average has asserted a grinding-lower downtrend. At least for the near-term.
Tactically, the late-April rally attempt stalled at its breakdown point (38,560) an area also detailed on the daily chart.
The late-April peak (38,561) registered within one point.
Slightly more broadly, three consecutive rally attempts have been capped by well-defined trendline resistance.
Against this backdrop, the Nasdaq Composite is also traversing a lower plateau.
Here again, the late-April rally attempt stalled slightly under its 50-day moving average, currently 16,052, an area also detailed on the daily chart below.
Widening the view to six months adds perspective.
On this wider view, the Nasdaq’s intermediate-term bias remains bearish as detailed previously. Consider the following:
The latest rally attempt has been capped by the 50-day moving average, currently 16,052, a widely-tracked intermediate-term trending indicator.
The slope of the 50-day moving average continues to flatten, also consistent with a potential trend shift. (Recall the 50-day’s bullish upturn amid the November trend shift. See the Nov. 8 review and Nov. 21 review.)
The index has registered a “lower low” vs. the March low and consecutive “lower highs” following the March peak.
Against this backdrop, sustained follow-through atop the 50-day moving average, and the 16,080 area would strengthen the bull case.
Conversely, the April low (15,222) is followed by major support matching the January breakout point (15,150).
Looking elsewhere, the Dow Jones Industrial Average has asserted a lower plateau.
To reiterate, the recent rally attempt has been capped by its breakdown point (38,560) an area detailed previously. (See the April 18 review.)
The late-April peak (38,561) — established April 23 — registered within one point.
Separately, the recent price action has been capped by the 20-day moving average (in green) a widely-tracked near-term trending indicator. Recall the trendline detailed on the hourly chart.
On a positive note, the Dow has thus far weathered several jagged tests of its January breakout point (37,825). But as always, major support is frequently violated on the third or fourth independent test. The next retest may add color.
Tactically, upside follow-through atop 38,560 would strengthen the bull case. Alternately, an eventual violation of the 37,825 area would confirm the Dow’s intermediate-term downtrend.
Meanwhile, the S&P 500 has also turned lower.
Amid the downturn, the S&P has maintained major support (4,950) an area detailed previously. The April low (4,953) registered nearby.
Coversely, the subsequent rally attempt has been capped by the 50-day moving average, currently 5,128, a widely-tracked intermediate-term trending indicator. The late-April peak (5,123) registered just points under the 50-day at the time.
The bigger picture
The major U.S. benchmarks have turned lower in recent weeks, pressured amid concerns that persistent inflation may contribute to a less accommodative policy backdrop than previously expected.
Amid the downturn, each big three benchmark has retained a posture under key technical levels, including the 50-day moving average. (The S&P and Nasdaq have closely observed the 50-day from underneath, while the Dow has nailed its breakdown point (38,560).)
Moving to the small-caps, the iShares Russell 2000 ETF (IWM) has asserted a lower plateau.
Tactically, the April downturn has been underpinned by major support matching the Sept. peak (191.85). The April low (191.34) registered in the vicinity.
More immediately, the recent lift from support has been flattish, and fueled by decreased volume. Note the rally attempt has been capped by the breakdown point (199.80) and the slightly more distant 50-day moving average. (Also see the April 18 review.)
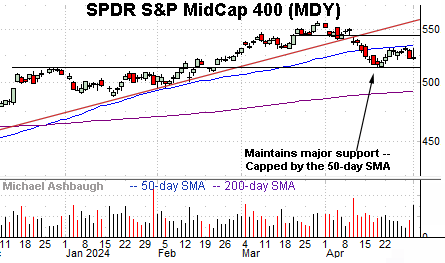
Similarly, the SPDR S&P MidCap 400 ETF (MDY) is digesting its downturn.
Here again, the recent lift from major support (512.50) has been sluggish, and fueled by decreased volume.
Tactically, the 50-day moving average, currently 534.80, has capped the rally attempt.
Returning to the S&P 500, the index is traversing a lower plateau amid a still bearish intermediate-term backdrop.
Recall the initial April downturn registered as relatively aggressive, encompassing an 11-to-1 down day, and a 6-to-1 down day, across consecutive sessions. (NYSE down volume surpassed up volume by the stated margin as the S&P 500 violated its 50-day moving average.)
By comparison, the subsequent rally attempt registered comparably tame internals, and topped just two points under the 50-day moving average amid a failed retest from underneath.
Tactically, upside follow-through atop the 5,125 area would strengthen the intermediate-term bull case. (See the late-April peak (5,123) and the 50-day moving average, currently 5,128.)
More broadly, the S&P’s longer-term bias remains bullish. Tactically, the 4,790-to-4,820 area marks important longer-term support. An eventual violation — which continues to look unlikely, based on today’s backdrop — would raise a technical red flag.
(On a granular note, this last-ditch support just detailed matches the 2021 closing high (4,793) and the absolute 2023 peak (4,793).
Also see April 18: Charting a bearish Q2 start, S&P 500 violates major support.
Also see April 4: Charting a sluggish Q2 start, S&P 500 asserts near-term resistance.


