


Charting a bearish Q2 start, S&P 500 violates major support
Focus: Q2 downdraft punctuated by bearish internals amid pending seasonal headwind

Technically speaking, the major U.S. benchmarks have turned lower, pressured amid aggressive selling pressure in spots.
In the process, each big three benchmark has violated its 50-day moving average, pressured amid potentially consequential price action across asset classes. The charts below add color:
Editor’s Note: As always, updates can be directly accessed at https://chartingmarkets.substack.com.
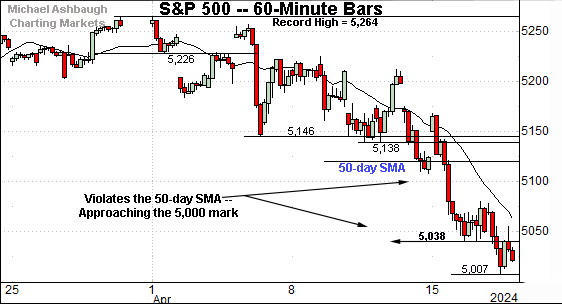
Before detailing the U.S. markets’ wider view, the S&P 500’s hourly chart highlights the past four weeks.
As illustrated, the S&P 500 has extended a pullback from all-time highs.
Amid the downturn, the index has violated its 50-day moving average, currently 5,118, and subsequently ventured under major support (5,038). Both areas are also detailed on the daily chart.

Meanwhile, the Dow Jones Industrial Average has asserted a steady April downtrend.
Note the trendline loosely tracks the 20-hour moving average, the hallmark of a strong near-term trend.
Tactically, a sustained rally atop the 38,000 area would signal waning bearish momentum.

Against this backdrop, the Nasdaq Composite has also turned lower.
The prevailing downturn places it under the 50-day moving average, currently 16,080, as well as major support (15,862) an area also detailed on the daily chart below.
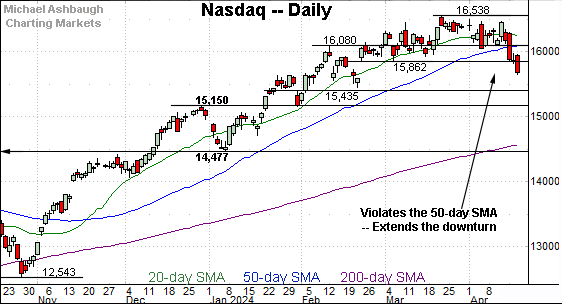
Widening the view to six months adds perspective.
On this wider view, the Nasdaq has turned lower, pressured amid a backdrop that presents caution flags. Consider the following:
The Nasdaq has violated its 50-day moving average, currently 16,080, a widely-tracked intermediate-term trending indicator.
The index has violated major support (15,862) matching the March low (15,862) and the Feb. gap (15,869).
The index has registered a “lower low” vs. the March low following a “lower high” at the April peak. This marks an early sign of a potential trend shift.
The slope of the 50-day moving average has flattened — and risks turning lower — consistent with a potential trend shift. (Recall the 50-day’s bullish upturn amid the November trend shift. See the Nov. 8 review and Nov. 21 review.)
So combined, the Nasdaq has signaled a bearish intermediate-term bias pending repairs. Tactically, a swift reversal atop the breakdown point (15,860) and the 50-day moving average would place the index on firmer technical ground.

Looking elsewhere, the Dow Jones Industrial Average has also reversed from record highs.
Amid the downturn, the Dow has placed distance under its 50-day moving average, currently 38,830.
More immediately, the Dow has ventured under the Jan. breakout point (37,825). (The 2023 peak (37,778) roughly matches this area.)
On further weakness, the 2022 peak (39,952) marks major support. The pending retest of this area — to the extent a retest registers — should be a useful bull-bear gauge.
More broadly, recall the 2024 peak (39,889) has registered slightly under the 40,000 mark. (Just 0.3% under, to be precise.)

Meanwhile, the S&P 500 has also extended an April pullback.
In the process, the index has violated its 50-day moving average, currently 5,118, as well as notable support matching the Feb. gap (5,038).
The prevailing downturn originates from major resistance (5,264) matching three straight weekly highs.
The bigger picture
As detailed above, the major U.S. benchmarks have extended their pullback, pressured amid a bearish second-quarter start. (Start of April.)
Amid the downturn, each big three benchmark has violated key technical levels, including the 50-day moving average.
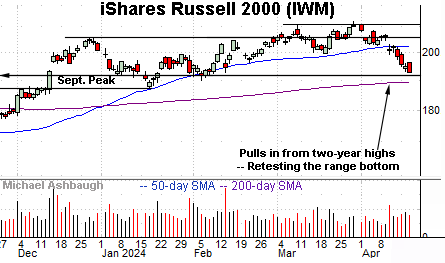
Moving to the small-caps, the iShares Russell 2000 ETF (IWM) has pulled in from two-year highs.
The prevailing downturn punctuates a mini double top defined by the March peaks. Notice last week’s violation of the 50-day moving average registered amid a volume spike.
Tactically, the breakdown point (199.80) pivots to resistance. The pending retest from underneath will likely add color.
Conversely, the 200-day moving average, currently 189.55, is followed by the Jan. low (187.53). A violation of these areas would raise a technical red flag.
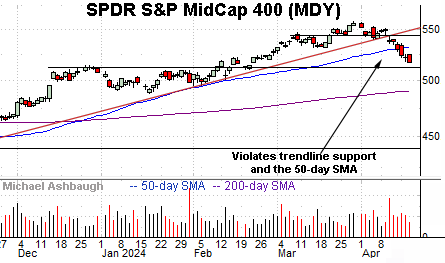
Meanwhile, the SPDR S&P MidCap 400 ETF (MDY) has reversed from record highs.
In its case, the trendline violation registered amid a volume spike, and has been punctuated by downside follow-through under the 50-day moving average.
Delving deeper, the MDY’s breakout point (512.50) marks important support.

Returning to the S&P 500, this next chart is a weekly view spanning 30 months. Each bar on the chart represents one week.
As illustrated, the S&P is digesting a massive five-month rally — from the Oct. 27 low (4,103) to the Mar. 28 peak (5,264) — spanning 1,161 points or 28.2%.
The January breakout placed the index in previously uncharted territory, likely contributing to persistent follow-through. Tactically, the breakout point (4,818) is defined by the 2022 peak, and marks the first notable floor on this weekly view.

Narrowing to the S&P 500’s six-month view, the chart above details several technical levels.
On a headline basis, the S&P has violated its 50-day moving average. But as always, it’s not just what the markets do, it’s how they do it.
By this measure, the prevailing downturn has encompassed unusually bearish price action.
Consider that the S&P concluded last week with a sharp downturn, narrowly maintaining its 50-day moving average at the time. That session (April 12) registered statistically unusual selling pressure in the form of an 11-to-1 down day. NYSE down volume surpassed up volume by an 11-to-1 margin.
Fast forward one market day, and the S&P started this week with downside follow-through, knifing decisively under its 50-day moving average. That session (April 15, tax day in the U.S.) registered as a 6-to-1 down day. NYSE down volume surpassed up volume by a 6-to-1 margin.
As always, in a textbook world, two 9-to-1 down days — across about a seven-session window — reliably signals a major trend shift.
So the prevailing downturn has not quite satisfied the textbook threshold, but it has come close, and the selling pressure has registered amid otherwise technically consequential price action. For instance, the 10-year Treasury note yield has concurrently taken flight along with several bellwether commodities. (See the April 4 review for added detail.)
Against this backdrop, the S&P 500 has asserted a bearish intermediate-term bias. The index has violated major support — the 5,040-to-5,080 area, detailed previously — amid statistically unusual price action. A swift reversal atop this area would neutralize the downdraft.
More broadly, the S&P’s longer-term bias remains bullish. Tactically, the 4,790-to-4,820 area marks important longer-term support. An eventual violation — which looks unlikely, based on today’s backdrop — would raise a technical red flag.
Beyond technical levels, the worst six months seasonally — May through October — are less than two weeks away. This bearish six-month phase is statistically significant, and a global phenomenon, applying beyond U.S. markets. (The best six months seasonally — November through April — have registered true to form in the broad sweep.)
Also see April 4: Charting a sluggish Q2 start, S&P 500 asserts near-term resistance.