Charting a sluggish Q2 start, S&P 500 asserts near-term resistance
Focus: 10-year Treasury note yield rises to headline technical test
Technically speaking, the major U.S. benchmarks continue to trend slowly, but steadily, higher.
Against this backdrop, each big three benchmark has pulled in modestly to start April, pressured from all-time highs registered late last month. The charts below add color:
Editor’s Note: As always, updates can be directly accessed at https://chartingmarkets.substack.com.
Before detailing the U.S. markets’ wider view, the S&P 500’s hourly chart highlights the past four weeks.
As illustrated, the S&P 500 has asserted a two-week range, digesting the mid-March spike.
The prevailing pullback has been underpinned by the breakout point (5,180) an area detailed previously. The April low (5,184) has registered nearby.
Similarly, the Dow Jones Industrial Average has reversed from record highs.
The prevailing downturn places the breakout point — the 39,170 area, detailed previously — back in play. (Also see the daily chart.)
Against this backdrop, the Nasdaq Composite has staged a slightly deeper pullback from record highs.
Nonetheless, the index remains range-bound, amid selling pressure that has thus far inflicted limited damage.
(The Nasdaq has pulled in as much as 2.4% from record highs, versus the Dow’s 1.8% downturn and the S&P 500’s pullback of 1.5%.)
Widening the view to six months adds perspective.
On this wider view, the Nasdaq continues to grind broadly higher. At least for now.
Tactically, the 50-day moving average, currently 15,972, is followed by major support (15,860), a level matching the March low (15,862) and February gap (15,869).
An eventual violation of the 15,860 area would raise a caution flag.
Looking elsewhere, the Dow Jones Industrial Average has topped slightly under a headline level.
Specifically, the Dow’s year-to-date peak has registered 111 points, or just 0.3%, under the marquee 40,000 mark.
More immediately, a retest of the breakout point (39,170) remains underway. The April 2 close (39,170) matched support, an area detailed previously.
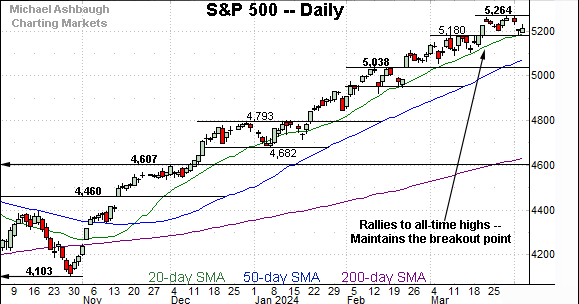
Meanwhile, the S&P 500 has asserted a higher plateau.
Tactically, the prevailing range top (5,264) matches three straight weekly highs. (In order, the weekly highs have registered at 5,261.1, then 5,264.9, and most recently 5,264.0.)
More broadly, the S&P 500 has staged a massive five-month rally, spanning 28.3% from the Oct. 27 low (4,103) to the March 28 peak (5,264).
The bigger picture
As detailed above, the major U.S. benchmarks are trending broadly higher.
Amid the upturn, each big three benchmark tagged an all-time high late last month, and has since pulled in, pressured amid a sluggish second-quarter start.
Moving to the small-caps, the iShares Russell 2000 ETF (IWM) continues to lag slightly behind.
Nonetheless, the small-cap benchmark is trending higher, briefly tagging a two-year peak to conclude the first quarter.
Tactically, the 50-day moving average remains an inflection point going back before November gap higher. The 50-day has effectively underpinned the year-to-date price action.
Meanwhile, the SPDR S&P MidCap 400 ETF (MDY) continues to outpace the small-caps.
As illustrated, the MDY tagged all-time highs to conclude the first quarter, and has since staged a shallow pullback.
Tactically, trendline support closely matches the breakout point (545.20).
Returning to the S&P 500, the index is trending steadily higher.
But amid the upturn, the S&P has established at least a near-term technical hurdle. To reiterate, the 5,264 area has effectively defined three straight weekly highs. (This area corresponds with the Dow’s approach of the 40,000 mark.)
Selling pressure near resistance has thus far been muted, though the potential downside follow-through is worth tracking.
Tactically, the 20-day moving average (in green) is closely followed by the breakout point (5,180) detailed previously. The early-April low (5,184) has registered nearby.
Delving deeper, the 50-day moving average, currently 5,078, is followed by firmer gap support (5,038).
As always, it’s not just what the markets do, it’s how they do it. But broadly speaking, the S&P 500’s bigger-picture bias remains bullish barring a violation of the 5,040-to-5,080 area.
Watch List — 10-year Treasury note yield reaches major technical test
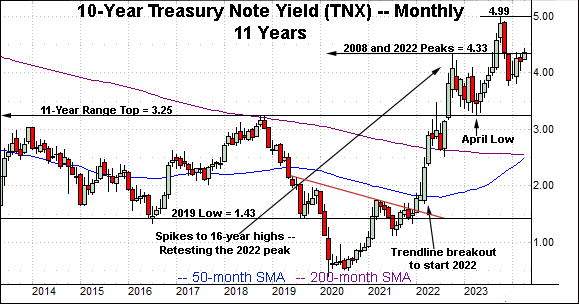
Concluding on a stray note, the 10-year Treasury note yield (TNX) has reached a potentially consequential technical test.
But backing up slightly, the yield initially spiked two months ago, knifing atop trendline resistance as well as the 50- and 200-day moving averages. (Feb. 5)
The yield has since tracked higher — amid an ascending triangle — rising to challenge an inflection point matching the 2008 peak (4.33) and 2022 peak (4.33).
Tactically, the yield’s ascending trendline — the 4.23 area — effectively matches the 50- and 200-day moving averages. A breakout attempt is in play barring a violation of this area. Upside follow-through would likely mark a pronounced headwind for U.S. stocks.
(Also see the Dec. 5 review and Sept. 27 review as it applies to the 4.33 inflection point. )


