Charting a bullish technical tilt, S&P 500 clears major resistance amid 10-to-1 up day
Focus: Bullish sector rotation persists as groups reclaim key levels, TRAN, XLF, KRE, XME, XBI, XLB
Technically speaking, the major U.S. benchmarks’ bigger-picture technical backdrop continues to strengthen.
On a headline basis, the S&P 500 has reclaimed major resistance (4,170), rising amid firmly-bullish market breadth — a nearly 11-to-1 up day — and still broadening sector participation. The charts below add color:
Editor’s Note: As always, updates can be directly accessed at https://chartingmarkets.substack.com.
Before detailing the U.S. markets’ wider view, the S&P 500’s hourly chart highlights the past four weeks.
As illustrated, the S&P has finally cleared major resistance (4,170) an area also detailed on the daily chart.
The upturn from the tight early-August range punctuates a bull-flag breakout.
Tactically, the breakout point (4,170) pivots to well-defined support.
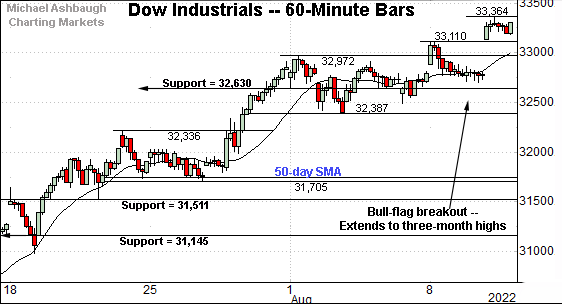
Similarly, the Dow Jones Industrial Average has extended its uptrend.
Here again, recent follow-through punctuates a bull-flag breakout — from the relatively tight early-August range — placing the index at three-month highs.
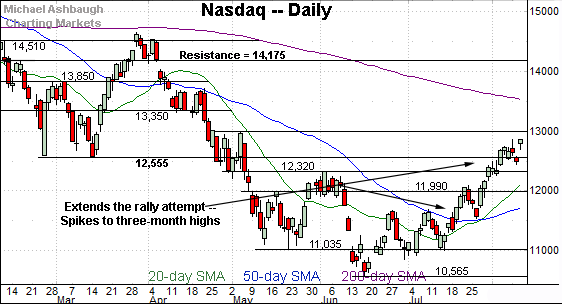
Against this backdrop, the Nasdaq Composite is also trending firmly higher.
The prevailing upturn builds on an aggressive late-July rally, better illustrated on the daily chart below.
Tactically, near-term support is not-so-well-defined on this near-term view. The 12,500 and 12,700 areas mark inflection points.
Widening the view to six months adds perspective.
On this wider view, the Nasdaq has extended an aggressive rally from the late-July low. Recall the prevailing upturn originates from a successful test of the 50-day moving average.
Also recall the late-July spike marked an unusually bullish two standard deviation breakout, detailed previously, encompassing three closes atop the 20-day Bollinger bands (not illustrated) across a narrow five-session span. (See the Aug. 4 review for added detail regarding the Bollinger bands.)
Tactically, the 12,525-to-12,555 area remains an inflection point. Deeper support matches the June range top (12,320).
Looking elsewhere, the Dow Jones Industrial Average has also tagged three-month highs.
The prevailing gap higher punctuates a bull flag — the tight early-August range — hinged to the steep late-July rally.
Recall the flag pattern signals muted selling pressure — despite an extended near-term posture — laying the groundwork for potential upside follow-through. (The upside follow-through has indeed registered in the present case.)
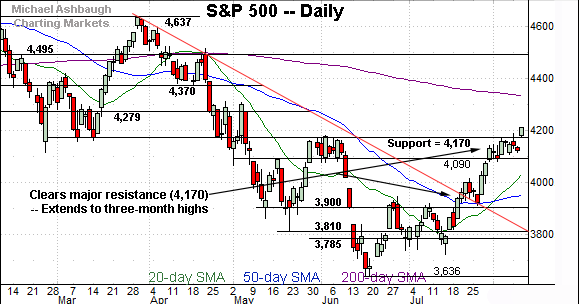
Meanwhile, the S&P 500 has staged the U.S. benchmarks’ headline breakout.
Specifically, the index has reclaimed major resistance (4,170) a key bull-bear fulcrum over the prior five months. (See the steep March rally from 4,170, and the aggressive June plunge from 4,170.)
The aggressive rally atop resistance (4,170) confirms the S&P 500’s trend shift, initially signaled last month. Market bulls have won a headline technical test.
The bigger picture
As detailed above, the U.S. benchmarks’ bigger-picture technical backdrop continues to strengthen.
On a headline basis, each big three benchmark has tagged three-month highs — by a respectable margin — confirming its intermediate-term uptrend initially signaled last month.
See the July 21 review: Charting a (potential) bullish trend shift, S&P 500 stages trendline breakout.
Moving to the small-caps, the iShares Russell 2000 ETF (IWM) has tagged another three-month high.
Recent follow-through places the 200-day moving average, currently 199.90, firmly within view.
Conversely, near-term support (190.90) is closely followed by a deeper floor in the 188.30 area.
Meanwhile, the SPDR S&P MidCap 400 ETF (MDY) has tagged two-month highs, rising from a bull flag.
Tactically, the breakout point (460.00) is followed by a firmer floor in the 452.60-to-453.40 area.
Market breadth still surging, stregthening bull case
Moving to the internals, the prevailing rally attempt continues to register unusually strong breadth statistics.
For instance, the NYSE registered nearly 11-to-1 positive breadth amid Wednesday’s rally atop major resistance at S&P 4,170. (Advancing volume surpassed declining volume by a nearly 11-to-1 margin.)
The upturn builds on the July 19 rally, a nearly 10-to-1 up day, as each big three U.S. benchmark reclaimed its 50-day moving average.
As always, two 9-to-1 updays — across about a seven-session window — reliably signals a major trend shift. (The early-2019 rally originated from two 9-to-1 up days across a precisely seven-session window.)
The prevailing rally encompasses two 10-to-1 up days across a wider 17-session window. So these area firmly bullish internals, though not precisely textbook bullish. (Market price action is rarely precisely textbook.)
(On a granular note, the prevailing rally has registered two lesser, but still firmly-bullish, single-day rallies — on the order of 6-to-1 up days — across a 20-session time frame. Moreover, a comparable down day has not registered across the same window.)
So collectively, the market internals continue to strengthen the bull case. (Also see the July 28 review, detailing improved market breadth.)
Returning to the S&P 500, the chart above highlights a potentially consequential technical event.
Specifically, the index has reclaimed its breakdown point (4,170) a headline bull-bear fulcrum.
The prevailing upturn punctuates a flag-like pattern — the tight August range — hinged to the steep late-July rally.
Tactically, the breakout point (4,170) pivots to well-defined support and is followed by the 4,090 floor. (The August closing low (4,091) matched support.)
A sustained posture atop the 4,090 area signals a comfortably bullish intermediate-term bias.
Beyond specific levels, the prevailing rally attempt has been punctuated by statistically unusual price action (two standard deviation breakouts), firmly-bullish internals (10-to-1 up days) and still broadening sector participation, partly detailed in the next section.
Watch List — Sector participation still broadening
Drilling down further, the Dow Transports (TRAN) — initially profiled July 19 and revisited July 28 — have tagged three-month highs.
In the process, the group has extended its trendline breakout, rising within view of the marquee 200-day moving average, currently 15,116.
As always, the 200-day moving average is a widely-tracked longer-term trending indicator. Sustained follow-through atop this area would raise the flag to a primary trend shift.
Conversely, the group’s breakout point — the 14,800 area — pivots to notable support.
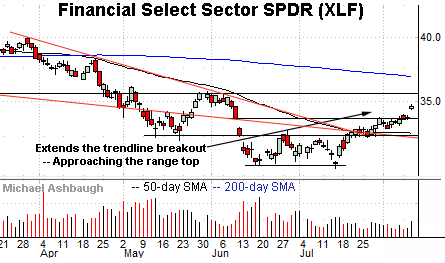
Meanwhile, the Financial Select Sector SPDR (XLF) — also profiled July 19 and revisited July 28 — continues to act well technically.
As illustrated, the group has tagged two-month highs, clearing resistance matching the June gap (33.73) and July closing peak (33.71).
The stronger-volume breakout confirms the trend shift signaled last month.
Tactically, the breakout point (33.70) pivots to well-defined support.
On further strength, the three-month range top — the 35.60-to-35.75 area — marks next resistance. The pending retest from underneath is worth tracking.
Drilling down within the financials, the SPDR S&P Regional Banking ETF (KRE) — profiled July 21, amid a trendline breakout — has extended its rally attempt.
In the process, the group has tagged three-month highs, edging atop resistance (65.30) amid increased volume.
The slight breakout places the 200-day moving average, currently 67.74, within striking distance.
More broadly, consider that each group detailed — the transports, financials and regional banks — staged a July trendline breakout in which the trendline closely tracked the 50-day moving average.
Looking elsewhere, the SPDR S&P Metals & Mining ETF (XME) has come to life technically.
As illustrated, the group has extended a trendline breakout, rising to reclaim its 200-day moving average, currently 49.50.
The 200-day moving average defined the May low, and remains an inflection point.
Delving slightly deeper, the former breakdown point (47.70) roughly matches trendline support and the 50-day moving average. The group’s rally attempt is intact barring a violation.
Similarly, the SPDR S&P Biotech ETF (XBI) is off to a bullish August start.
Technically, the group has knifed from a tight one-month range — a coiled spring — rising amid increased volume.
Moreover, the group has subsequently held tightly to the 200-day moving average, currently 92.10, signaling muted selling pressure near major resistance.
The prevailing flag-like pattern — the tight three-session range — has formed amid decreased volume, improving the chances of upside follow-through. Tactically, the post-breakout low (89.14) is followed by the firmer breakout point (84.90).
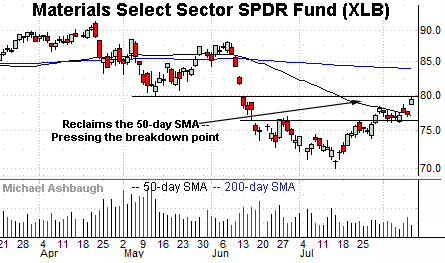
Finally, the Materials Select Sector SPDR (XLB) is lagging behind most other sectors.
Still, the group has reclaimed its 50-day moving average — a recent bull-bear hurdle — rising to challenge its breakdown point, circa 79.80. (See the March closing low (79.77) and June gap (79.76).)
Follow-through atop this area would strengthen the group’s bull case.
Tactically, the prevailing rally attempt is intact barring a violation of support in the 76.10 area.


