Charting a bull-bear battle, S&P 500's rally attempt meets major resistance (4,170)
Focus: Consumer staples sector reclaims 200-day average, Apple and Amazon stage technical breakouts, XLP, AAPL, AMZN, CSCO, KO
Technically speaking, the major U.S. benchmarks continue to act well amid a largely sideways, but still constructive, August start.
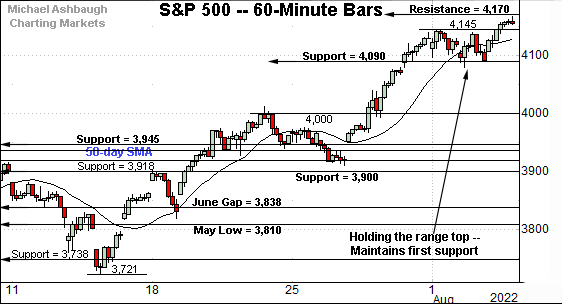
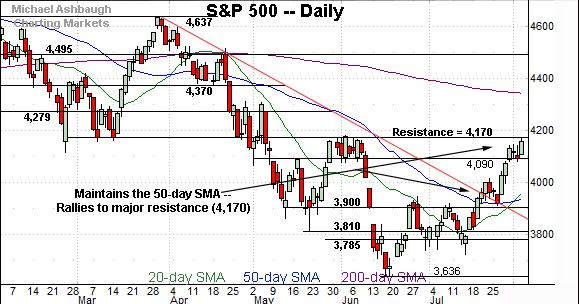
Against this backdrop, the S&P 500 has effectively tagged major resistance (4,170) a level closely matching the August peak (4,167). This area marks the immediate technical battleground, and the pending response — across potentially the next several sessions — should be a useful bull-bear gauge.
Editor’s Note: As always, updates can be directly accessed at https://chartingmarkets.substack.com.
Before detailing the U.S. markets’ wider view, the S&P 500’s hourly chart highlights the past four weeks.
As illustrated, the S&P has asserted an early-August flag-like pattern. The prevailing range has been underpinned by first support (4,090) detailed previously.
The week-to-date closing low (4,091) has matched support.
Conversely, the rally attempt has thus far topped just under major resistance (4,170) an area better illustrated on the daily chart.
To reiterate, the August peak (4,167) has registered nearby.
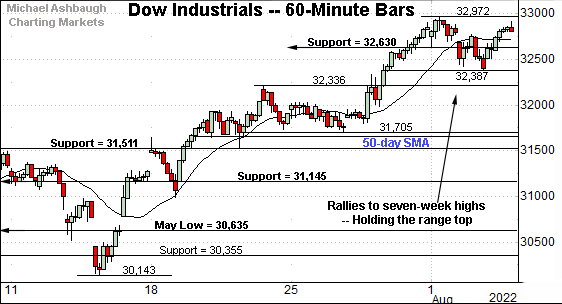
Similarly, the Dow Jones Industrial Average is holding its range top.
Tactically, the 32,630 area remains an inflection point, also detailed on the daily chart.
Delving deeper, the 50-day moving average, currently 31,694, is followed by the firmer breakout point (31,510). A sustained posture atop this area signals a bullish intermediate-term bias.
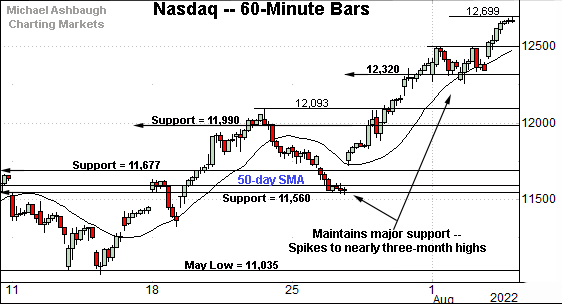
Against this backdrop, the Nasdaq Composite continues to trend higher.
From current levels, the 12,500 mark is followed by an inflection point around 12,320, also detailed on the daily chart below.
Widening the view to six months adds perspective.
On this wider view, the Nasdaq has knifed to nearly three-month highs, its best level since May 5.
In the process, the index has reclaimed the May breakdown point (12,555) an area that would be expected to draw selling pressure on the first retest. (This area corresponds with S&P 4,170.)
Against this backdrop, the prevailing upturn has marked an unusually strong two standard deviation breakout. Three of the Nasdaq’s prior five closes have registered atop the 20-day Bollinger bands (not illustrated), also known as volatility bands.
As always, consecutive closes atop the bands (as in the current case) signal a near-term extended posture due at least a sideways chopping around phase, if not a respectable pullback.
But more broadly, bullish momentum has registered as extreme, and statistically unusual, improving the chances of longer-term upside follow-through. Time will tell, against the current backdrop.
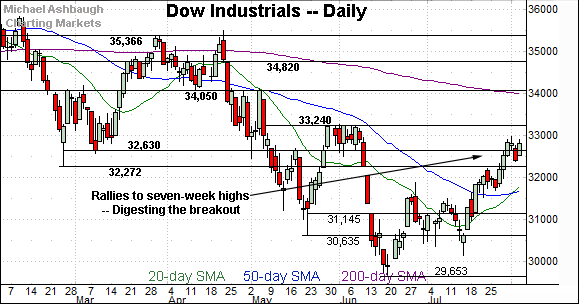
Looking elsewhere, the Dow Jones Industrial Average has asserted an August holding pattern.
Its late-July breakout registered consecutive closes atop 20-day Bollinger bands (not illustrated), though it has not yet followed through along with the Nasdaq.
Tactically, the 32,270 area marks a notable floor. (February low, June gap.)
Delving deeper, the 31,510-to-31,690 area marks a more important floor, levels matching the breakout point and the 50-day moving average. (Also see the hourly chart.)
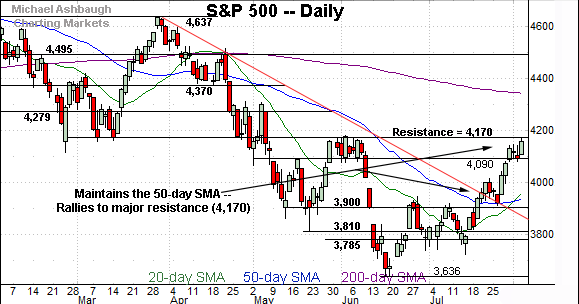
Meanwhile, the S&P 500 has reached a headline technical test.
Consider that the August peak (4,167) has registered just under major resistance (4,170), a familiar bull-bear inflection point detailed repeatedly.
Conversely, the early-August range has been underpinned by familiar support (4,090).
And on a granular note, the S&P’s late-July spike also marked a two standard deviation breakout, registering consecutive closes atop 20-day volatility bands (not illustrated).
The bigger picture
As detailed above, the major U.S. benchmarks continue to act well technically.
On a headline basis, each big three benchmark has sustained its late-July breakout, and is off to a sideways, if not slightly higher August start.
Against this backdrop, the S&P 500 has reached seriously major resistance (4,170) and the response to this area may set the immediate technical tone.
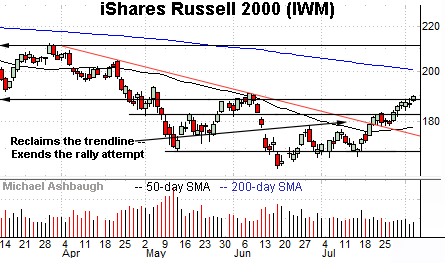
Moving to the small-caps, the iShares Russell 2000 ETF (IWM) continues to grind higher.
Tactically, initial support (188.30) is followed by a deeper floor around 182.50. A sustained posture atop this area signals a bullish intermediate-term bias.
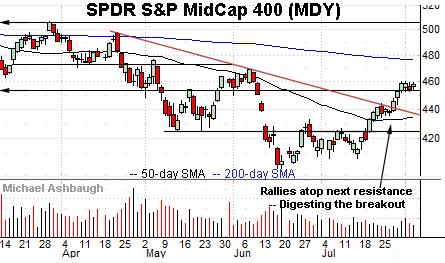
Meanwhile, the SPDR S&P MidCap 400 ETF (MDY) has sustained its recent breakout.
Tactically, near-term support — the 452.60-to-453.40 area — closely matches the 100-day moving average, not illustrated.
Delving deeper, trendline support closely matches the 50-day moving average.
Returning to the S&P 500, the index has reached a headline technical test.
As detailed previously, the May breakdown point (4,170) marks major resistance, perhaps the most significant overhead of the levels detailed above.
The August peak (4,167) has registered nearby, and at least modest selling pressure has surfaced. The pending downside follow-through, or lack thereof, may add color.
Conversely, the August range has been underpinned by familiar support (4,090) amid a developing flag-like pattern. Constructive price action.
Delving deeper, the 4,000 mark is followed by an important floor in the 3,920-to-3,935 area. (The 50-day moving average, and the post-breakout closing low.)
Tactically, a sustained posture atop the 3,920 area signals a bullish intermediate-term bias.
More broadly, the S&P 500’s longer-term bias remains bearish pending more extensive repairs.
Watch List
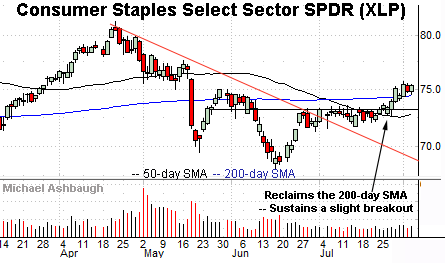
Drilling down further, the Consumer Staples Select Sector SPDR (XLP) has come to life technically. (Yield = 2.5%.)
Specifically, the group has reclaimed its 200-day moving average — a widely-tracked longer-term trending indicator — rising to tag 10-week highs.
Tactically, the 200-day moving average, currently 74.44, is followed by the breakout point (73.20). The prevailing rally attempt is intact barring a violation.
(The 50-day moving average has also marked an inflection point, and is rising toward support.)
Moving to specific names, Dow 30 component Apple, Inc. (AAPL) — most recently profiled July 19 — continues to act well technically.
Late last month, the shares knifed atop the 200-day moving average, rising after the company’s strong quarterly results.
The subsequent pullback has been comparably flat, fueled by decreased volume, and punctuated by upside follow-through.
Tactically, gap support (159.50) closely matches the 200-day moving average, currently 159.32. A sustained posture higher signals a comfortably bullish bias.
(Also see the July 7 review, as Apple’s trendline breakout signaled a trend shift.)
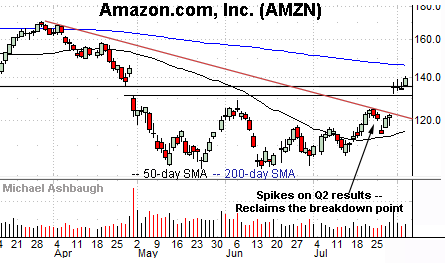
Similarly, Amazon.com, Inc. (AMZN) has taken flight.
As illustrated, the shares have knifed atop trendline resistance, gapping sharply higher after the company’s second-quarter results.
Moreover, the subsequent hesitation at the breakdown point (135.80) has been punctuated by upside follow-through.
Tactically, the April gap broadly spans from about 130.75 to 135.80 and has marked an inflection point. A sustained posture higher signals a bullish intermediate-term bias.
On further strength, the 200-day moving average, currently 146.04, is descending within striking distance.
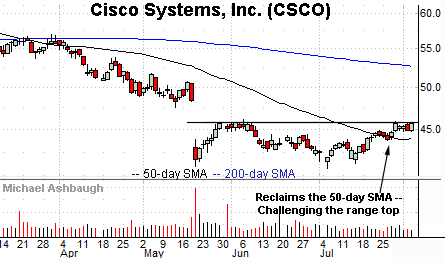
Looking elsewhere, Cisco Systems, Inc. (CSCO) is a Dow 30 component showing signs of life. (Yield = 3.4%.)
Late last month, the shares rallied atop the 50-day moving average, rising to challenge the 10-week range top — the 45.80-to-46.10 area.
More immediately, the prevailing tight one-week range signals muted selling pressure near resistance, laying the groundwork for a potentially decisive breakout.
Tactically, near-term support (44.75) is followed by the 50-day moving average, currently 44.00. A breakout attempt is in play barring a violation.
(Note the 50-day moving average’s slope has ticked fractionally higher, consistent with a trend shift.)
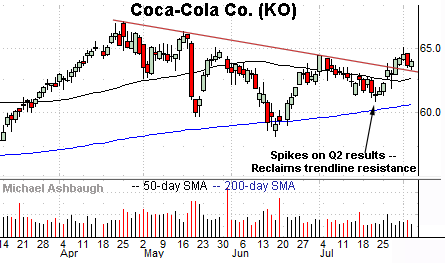
Finally, Coca-Cola Co. (KO) is another Dow 30 component coming to life. (Yield = 2.7%.)
As illustrated, the shares have reclaimed trendline resistance — as well as the 50-day moving average — rising after the company’s quarterly results.
The breakout punctuates a modified head-and-shoulders bottom defined by the late-April, June and July lows. As always, the head-and-shoulders bottom is a high-reliability bullish reversal pattern.
Tactically, the 50-day moving average, currently 62.60, offers an area to work against. The prevailing rally attempt is intact barring a violation.
(Coca-Cola is the second-largest component of the Consumer Staples Select Sector SPDR (XLP), detailed previously, accounting for about a 9.9% sector weighting.)


