Charting a bull-bear battle, S&P 500 challenges the breakdown point (3,636)
Focus: Influential global markets digest breakdown, Brazil continues to outperform, IEV, EWJ, FXI, EWZ
Technically speaking, the major U.S. benchmarks continue to whipsaw as October volatility persists.
Amid the cross currents, the S&P 500 has reversed from 23-month lows, rising to challenge its breakdown point (3,636). This area defines the immediate bull-bear battleground and the pending retest from underneath will likely add color.
Editor’s Note: As always, updates can be directly accessed at https://chartingmarkets.substack.com.
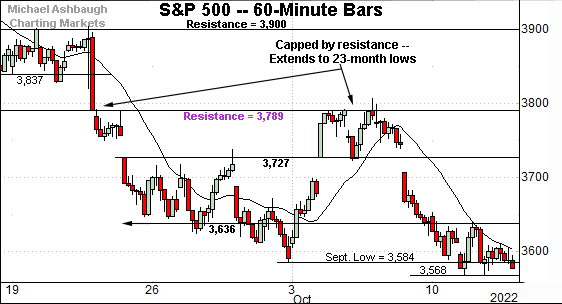
Before detailing the U.S. markets’ wider view, the S&P 500’s hourly chart highlights the past four weeks.
As illustrated, the S&P is holding its range bottom.
The prevailing downturn originates from major resistance (3,789) — detailed previously — established immediately after the Federal Reserve’s latest policy statement. The October closing high (3,790) matched resistance (3,789).
More immediately, the breakdown point (3,636) marks resistance, an area also detailed on the daily chart.
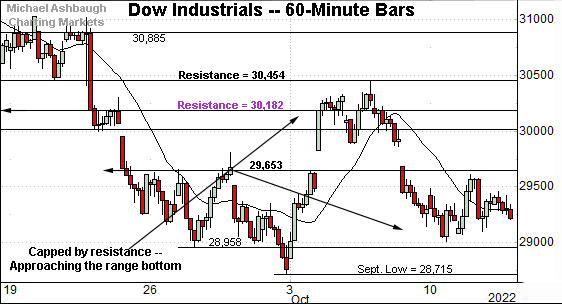
Meanwhile, the Dow Jones Industrial Average has diverged modestly from the other major benchmarks.
Nonetheless, the index is broadly holding its one-month range bottom.
Here again, the breakdown point (29,653) marks resistance, an area also detailed on the daily chart.
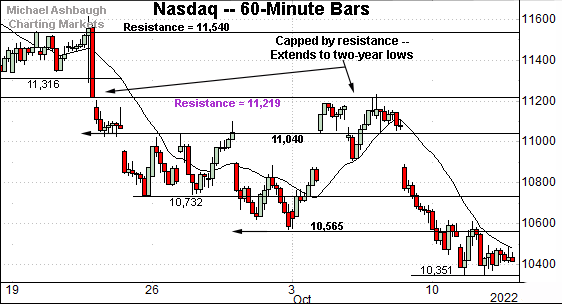
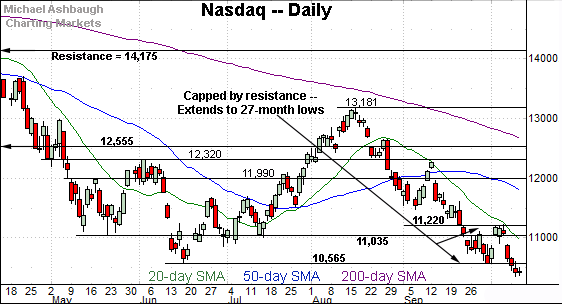
Against this backdrop, the Nasdaq Composite remains incrementally weaker.
Like the S&P 500, the Nasdaq’s downturn originates from well-defined overhead (11,219).
More immediately, the breakdown point (10,565) marks resistance, an area also detailed below.
Widening the view to six months adds perspective.
On this wider view, the Nasdaq has tagged 27-month lows, its lowest level since July 2020. (Thursday’s early intraday low (10,088), not illustrated, also marks the lowest level since July 2020.)
From current levels, the breakdown point (10,565) pivots to first resistance.
This is followed by gap resistance (10,891) and more distant overhead at 11,220, a level detailed on the hourly chart. Tactically, a reversal atop this area would mark a step toward stabilization.
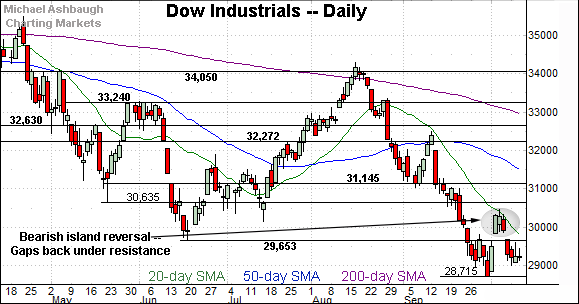
Looking elsewhere, the Dow Jones Industrial Average has reversed to its former range.
The prevailing downturn punctuates a bearish island reversal defined by gaps to start the fourth quarter.
Tactically, the breakdown point (29,653) is closely followed by gap resistance (29,685). Sustained follow-through atop this area would mark technical progress.
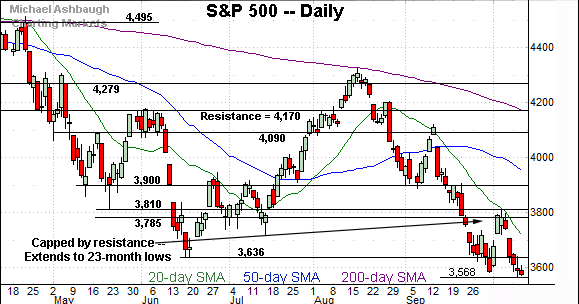
Meanwhile, the S&P 500 has extended its downturn, tagging a 23-month low.
To reiterate, the breakdown point (3,636) pivots to initial resistance.
Slightly more broadly, the 20-day moving average — (in green, currently 3,708) — is a widely-tracked near-term trending indicator. The pending retest from underneath may add color.
(The Nasdaq’s 20-day moving average has also defined recent trends.)
The bigger picture
As detailed above, the bigger-picture backdrop remains bearish amid a volatile fourth-quarter start.
Against this backdrop, the S&P 500 is vying to rally from 23-month lows, rising (at least for now) despite the latest round of hotter-than-expected inflation data.
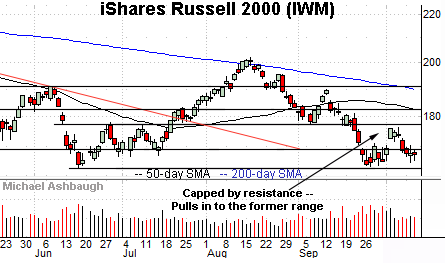
Moving to the small-caps, the iShares Russell 2000 ETF (IWM) continues to diverge from the S&P 500 and Nasdaq Composite.
Recall the small-cap benchmark’s September low registered three sessions before the major benchmarks. More immediately, the Russell 2000 had maintained its range bottom through mid-week.
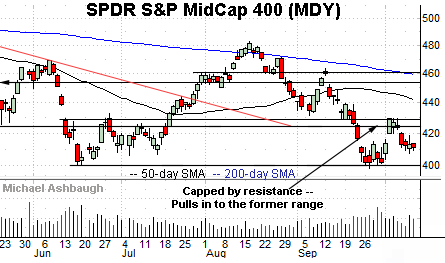
Similarly, the SPDR S&P MidCap 400 ETF (MDY) has strengthened slightly versus the S&P 500.
Still, the October rally attempt has been capped by familiar resistance. Market bears might point to a developing head-and-shoulders top.
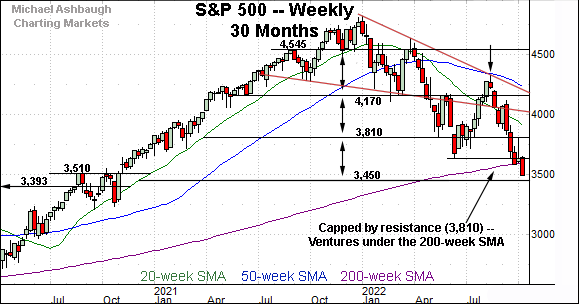
Returning to the S&P 500, this next chart is a weekly view spanning 30 months. Each bar on the chart represents one week.
Recall the S&P has balked at major resistance (3,810), detailed previously.
Last week’s high (3,807) registered nearby, and the index has turned lower.
More immediately, the index has at least briefly ventured under its 200-week moving average, currently 3,599.
Until the current retest, the S&P had not traded under its 200-week moving average since March 2020, amid a brief three-week stint lower, as the pandemic kicked off.
Broadening before the pandemic era, the S&P 500 has not registered three straight weekly closes under the 200-week moving average since 2010, as the markets re-emerged from the financial crisis, and the Great Recession.
The prevailing retest of this area — across potentially several weeks — remains a “watch out.”
Returning to the six-month view, the S&P 500 has tagged 23-month lows.
Tactically, the S&P’s breakdown point (3,636) marks its first notable overhead. A reversal atop this area would mark technical progress.
On further strength, the 20-day moving average, currently 3,708, is followed by gap resistance at 3,727. (Also see the hourly chart.)
Eventual follow-through atop this area would signal a potentially viable near-term rally attempt.
More broadly, the S&P 500’s bigger-picture backdrop remains bearish pending extensive repairs.
Charting the global-market backdrop
Beyond the U.S., influential global markets remain on the defensive:
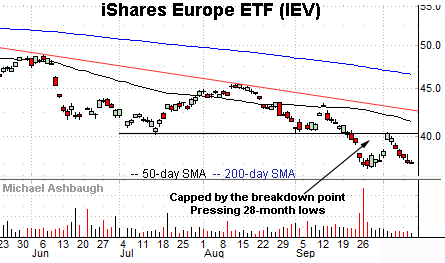
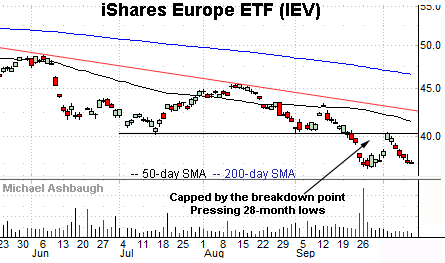
To start, the iShares Europe ETF (IEV) is digesting a downdraft to 28-month lows, its worst level since May 2020.
Tactically, the recent rally attempt has stalled near the breakdown point (40.25), an area detailed previously. (See the Sept. 22 review.)
Eventual follow-through atop this area would mark an early step toward stabilization.
Meanwhile, the iShares MSCI Japan ETF (EWJ) has recently tagged 30-month lows, its worst level since April 2020 amid the height of the pandemic.
Here again, the recent rally attempt has been capped by the breakdown point (51.55), an area detailed previously.
Tactically, trendline resistance has descended to match the breakdown point.
Looking elsewhere, the iShares China Large-Cap ETF (FXI) has reached 13-year lows, its worst level since March 2009 amid the depth of the financial crisis.
The prevailing downturn originates from trendline resistance — and the breakdown point (27.80) — areas detailed previously. (See the Sept. 22 review.)
From current levels, the Sept. low (25.65) pivots to first resistance. A reversal atop this area might place the brakes on bearish momentum. (Also see the 18-year chart.)
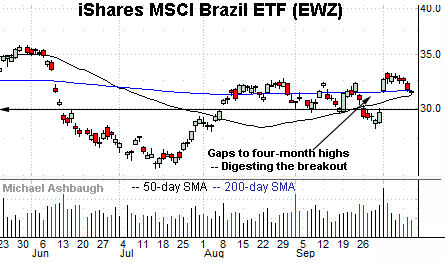
Concluding with a bright spot, the iShares MSCI Brazil ETF (EWZ) — profiled Sept. 15 — continues to act relatively well.
The shares started October with a breakout, gapping atop the 200-day moving average amid a volume spike. By comparison, the subsequent pullback has been flattish, placing the shares 5.8% under the October peak.
Tactically, the 50-day moving average is followed by gap support (30.00). A sustained posture atop this area signals a bullish bias.

