Bearish momentum persists: S&P 500 and Dow industrials retest major support
Focus: Brazil sustains summer breakout, Alphabet and Meta Platforms challenge major support, Warren Buffett's Occidental Petroleum vies to maintain key support, EWZ, GOOGL, META, SNOW, OXY
Technically speaking, the U.S. benchmarks’ bigger-picture backdrop remains jagged and largely bearish.
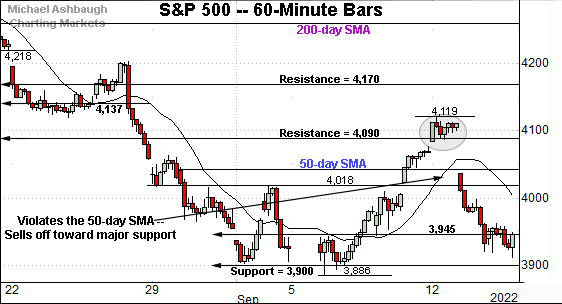
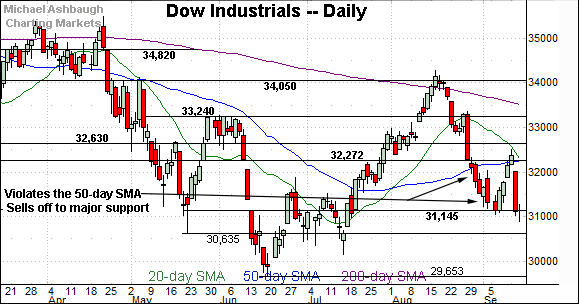
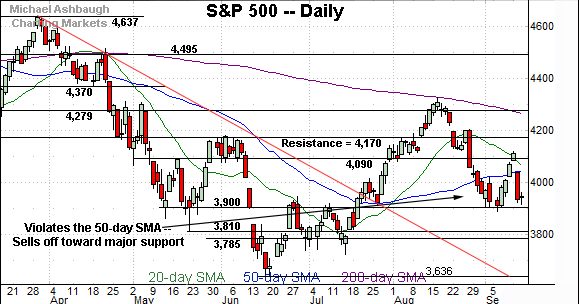
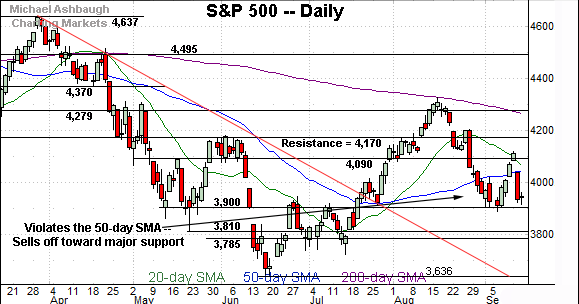
On a headline basis, each big three U.S. benchmark has re-violated its 50-day moving average, pressured amid a massive single-day downdraft placing major support under siege — the S&P 3,900 and Dow 31,145 areas.
Tactically, the week-to-date low (S&P 3,902) and Wednesday’s close (Dow 31,135) have closely matched support. The quality of the rally from these areas will likely add color.
Editor’s Note: As always, updates can be directly accessed at https://chartingmarkets.substack.com.
Before detailing the U.S. markets’ wider view, the S&P 500’s hourly chart highlights the past four weeks.
As illustrated, the S&P has violated its 50-day moving average, selling off toward the range bottom.
The prevailing downturn places major support (3,900) within view, an area also detailed on the daily chart.
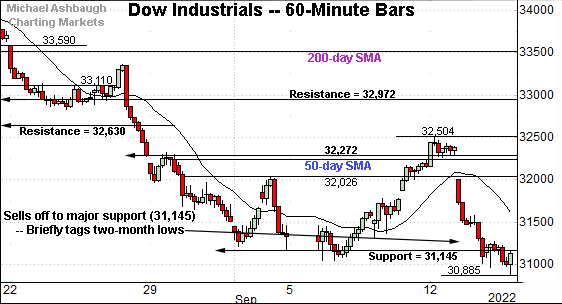
Meanwhile, the Dow Jones Industrial Average has tagged a two-month low, its lowest level since July 15.
Tactically, a retest of major support (31,145) remains underway, an area also detailed on the daily chart.
Wednesday’s close (31,135) registered nearby.
Slightly more broadly, the prevailing downturn punctuates a violation of the 50-day moving average.
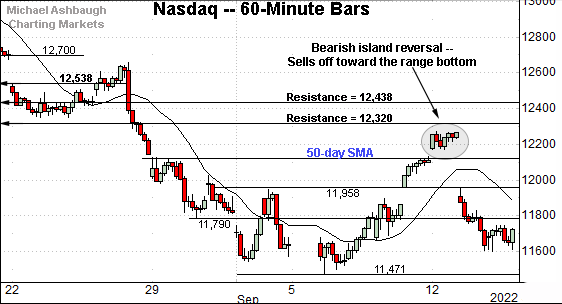
Against this backdrop, the Nasdaq Composite has also extended toward its range bottom.
The prevailing downturn punctuates a small island reversal defined by gaps near the 50-day moving average.
Though the island reversal is generally a high-reliability reversal pattern, its reliability strengthens with the pattern’s duration, and the gaps’ size, both of which are small in the present case.
(Also see the S&P 500’s similar reversal near the 4,090 mark on the hourly chart.)
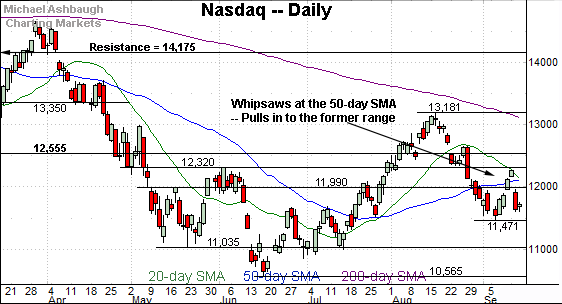
Widening the view to six months adds perspective.
On this wider view, the Nasdaq has whipsawed amid recently hotter-than-expected inflation data.
The prevailing downturn places the index back under its 50-day moving average, currently 12,114.
More broadly, the 50% retracement of the downturn from the August peak to the September low rests at 12,326, closely matching the 12,320 resistance. This area also defines the June peak (12,320), a level from which the plunge to the 2022 low (10,565) originated.
Looking elsewhere, the Dow Jones Industrial Average has plunged to its range bottom.
Consider that Tuesday’s 1,276-point downdraft marked the seventh-largest point loss in history.
Tactically, the downturn places major support (31,145) — detailed repeatedly — back in play.
Wednesday’s close (31,135) registered nearby amid an extended retest.
Meanwhile, the S&P 500 has also reversed toward its range bottom.
The prevailing downturn places major support (3,900) firmly within view. (See the May closing low (3,900), the June gap (also 3,900) and the early-summer range top.)
Separately, the bottom of this week’s gap (4,037) closely matches the 50-day moving average, currently 4,039.
The bigger picture
As detailed above, the bigger-picture backdrop remains volatile, and largely bearish.
On a headline basis, each big three U.S. benchmark has re-violated its 50-day moving average, plunging after hotter-than-expected inflation data.
In the process, each index registered its worst daily downdraft since 2020, amid the height of the pandemic.
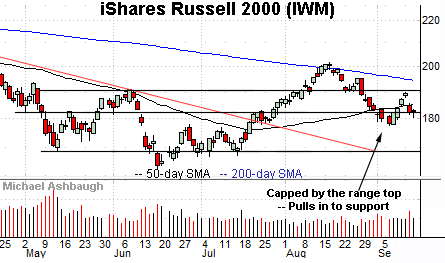
Moving to the small-caps, the iShares Russell 2000 ETF (IWM) has whipsawed at its 50-day moving average, currently 185.54.
The prevailing downturn punctuates a failed test of the former range top (190.90).
More immediately, familiar support (182.50) is followed by the September low (177.50).
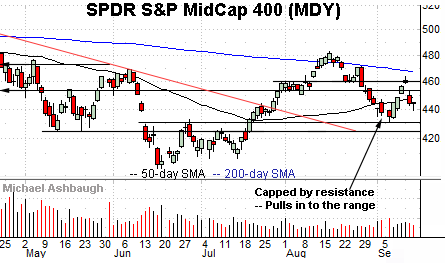
Similarly, the SPDR S&P MidCap 400 ETF (MDY) has recently whipsawed near the 50-day moving average.
More broadly, the small- and mid-cap benchmarks remain capped by the descending 200-day moving average, signaling a longer-term downtrend.
Aggressive bearish momentum resurfaces
Beyond the charts, consider Tuesday’s inflation-fueled downdraft’s sheer size.
For the session, the Dow industrials plunged 1,276 points (3.9%), the Nasdaq Composite dropped 633 points (5.2%) and the S&P 500 lost 178 points (4.3%).
These are massive single-day prints, on a scale normally reserved for the emerging markets. U.S. benchmarks don’t register single-day downdrafts of 4% to 5% under healthy market conditions.
Amid the downturn, Tuesday’s underlying market breadth stats signaled almost off-the-charts bearish momentum. Declining volume surpassed advancing volume by nearly 19 to 1 on the NYSE and by a massive 36 to 1 on the Nasdaq.
Generally speaking, readings on the order of 9-to-1 are exceptional, and mark technical reference points.
(On a granular note, the NYSE registered a 10-to-1 up day last Friday — as the S&P reclaimed its 50-day moving average — and that rally has been more than nullified by this week’s aggressive downdraft.)
Returning to the S&P 500, the index has reversed sharply from the September peak.
The prevailing downturn places it back under the 50-day moving average, currently 4,039. Recall the bottom of this week’s gap (4,037) closely matches the 50-day.
So tactically, a rally atop the 4,040 resistance might be noteworthy. Still, sustained follow-through atop the 4,090-to-4,120 area would more firmly raise the flag to a potential intermediate-term trend shift. (Also see the hourly chart.)
Conversely, the 3,900 mark remains important support. As detailed previously, an eventual violation would mark a material “lower low” — to punctuate a downdraft from the 200-day moving average — opening the path to potentially material selling pressure.
The week-to-date low (3,902) has registered just above major support.
More broadly, the S&P 500’s intermediate- to longer-term bias remains bearish based on today’s backdrop. The quality of the S&P 500’s rally from the 3,900 mark, or lack thereof, will likely add color.
Also see Sept. 7: Charting a shaky September start: S&P 500 and Dow industrials nail major support.
Watch List
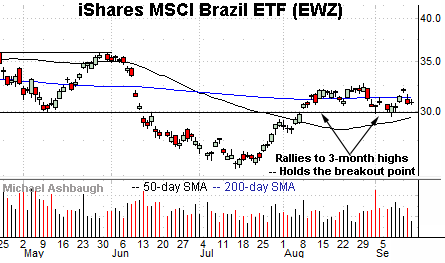
Drilling down further, the iShares MSCI Brazil ETF (EWZ) is acting relatively well technically.
As illustrated, the shares have sustained an August breakout, asserting a one-month range hinged to the 200-day moving average.
Tactically, the breakout point (29.90) is underpinned by the ascending 50-day moving average, currently 29.50. A sustained posture atop this area signals a bullish intermediate-term bias.
Moving to specific names, Alphabet Inc. (GOOGL) has reached an important technical test.
Specifically, the shares are pressing a four-month range bottom defined by the July closing low (105.02).
Wednesday’s close (105.00) matched support.
More broadly, the prevailing downturn marks the fourth test of the range bottom. As always, major support is frequently violated on the third or fourth independent approach.
Tactically, a swift reversal atop the September peak (111.60) would place the shares on firmer technical ground.
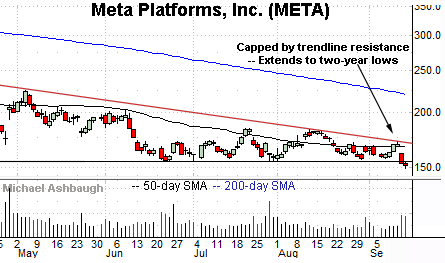
Meanwhile, Meta Platforms, Inc. (META) — the company formerly known as Facebook — is tenuously positioned.
As illustrated, the shares have tagged 30-month lows, the lowest level since March 2020 amid the height of the pandemic.
The prevailing downturn originates from trendline resistance, and has been fueled by increased volume.
Tactically, a reversal atop the breakdown point (155.20) would mark a step toward stabilization. A sustained posture under this area signals a bearish bias.
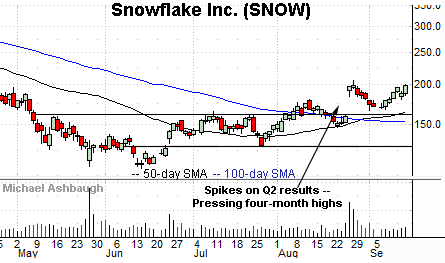
Looking elsewhere, Snowflake, Inc. (SNOW) is a well positioned large-cap cloud-data platform provider.
Late last month, the shares gapped sharply higher, rising after the company’s second-quarter results.
The subsequent pullback has been fueled by decreased volume, and punctuated by a rally to the range top despite a down market.
Tactically, a near-term target projects to the 225 area on follow-through. Conversely, the week-to-date low (179.90) is followed by the ascending 50-day moving average, currently 164.30, a recent bull-bear inflection point.
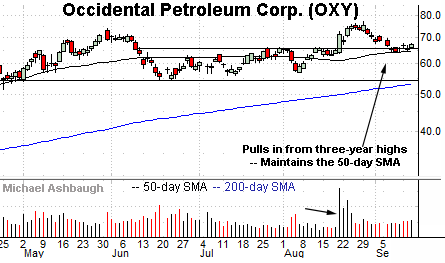
Finally, Occidental Petroleum Corp. (OXY) is a well positioned large-cap oil and gas name.
The shares initially spiked three weeks ago, rising after Warren Buffett’s Berkshire Hathaway disclosed it has received regulatory approval to buy up to 50% of the company. (Berkshire owns about 20% of the company per a second-quarter disclosure.)
The subsequent pullback places the shares 14.8% under the August peak.
Tactically, the breakout point (65.70) is closely followed by the 50-day moving average, currently 64.80. A sustained posture atop this area signals a bullish bias.


