Charting a third-quarter whipsaw, S&P 500 stalls at the breakdown point (3,900)
Focus: Dow Transports teeter on major support, Global markets reach headline technical tests, TRAN, XLV, IEV, FXI, EWJ
Technically speaking, the major U.S. benchmarks have tagged two-month lows, pressured amid a volatility spike after the Federal Reserve’s policy guidance.
Against this backdrop, the S&P 500 has staged a bear-flag breakdown, selling off respectably from major resistance (3,900). The pending downside follow-through, or lack thereof, will likely add color.
Editor’s Note: As always, updates can be directly accessed at https://chartingmarkets.substack.com.
Before detailing the U.S. markets’ wider view, the S&P 500’s hourly chart highlights the past four weeks.
As illustrated, the S&P has tagged two-month lows, pressured amid a pronounced single-hour downdraft after the Federal Reserve’s policy statement.
The prevailing downturn punctuates a bear flag, the tight range capped by the breakdown point (3,900).
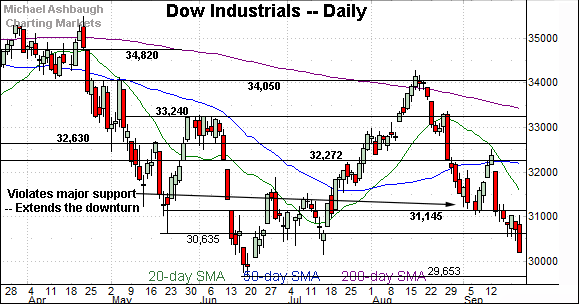
Similarly, the Dow Jones Industrial Average has registered two-month lows.
Here again, the prevailing downturn punctuates a flag-like pattern, capped by major resistance (31,145) detailed previously.
Bearish price action.
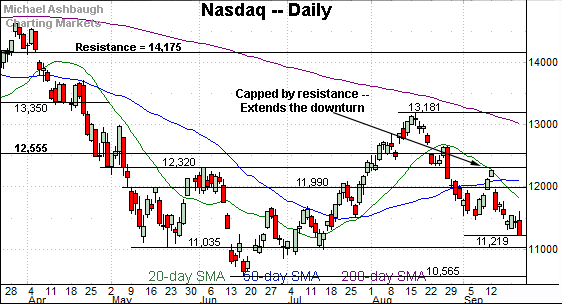
Against this backdrop, the Nasdaq Composite has also extended its downturn.
Tactically, the breakdown point — the 11,540 area — marks notable resistance.
Slightly more broadly, recall recent weakness punctuates a small island reversal at the September peak.
Widening the view to six months adds perspective.
On this wider view, the Nasdaq has extended a downturn to two-month lows.
From current levels, the next notable support (11,035) rests slightly above the 11,000 mark.
Slightly more broadly, the 50% retracement of the downturn from the August peak to the September low rests at 12,326, closely matching the 12,320 resistance. This area also defines the June peak (12,320), a level from which the plunge to the 2022 low (10,565) originated.
Looking elsewhere, the Dow Jones Industrial Average has extended an aggressive September downdraft.
In the process, the index has placed distance under major support (31,145) — detailed previously — an area that pivots to resistance.
Amid the downturn, the Dow has registered the year’s third-worst close. Delving deeper, the 2022 closing low (29,888) is followed by the absolute 2022 low (29,653), both established June 17.
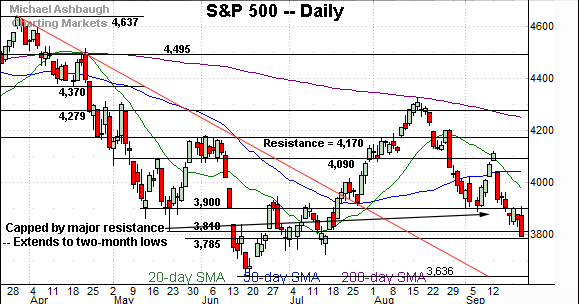
Meanwhile, the S&P 500 is also trending lower.
Recent downside follow-through punctuates a failed test of the breakdown point (3,900) from underneath. (Also see the hourly chart.)
The bigger picture
As detailed above, the major U.S. benchmarks are not acting well technically.
On a headline basis, each index has tagged its latest two-month low, pressured amid a failed test of resistance after the Federal Reserve’s policy guidance.
Tactically, the S&P 3,900 area, and Dow 31,145, continue to stand out as overhead inflection points.
Moving to the small-caps, the iShares Russell 2000 ETF (IWM) has extended a pullback from resistance at the September peak.
The prevailing downturn has been punctuated by a sustained volume increase.
Similarly, the SPDR S&P MidCap 400 ETF (MDY) has extended a downturn from resistance near the September peak.
More broadly, the small- and mid-cap benchmarks have placed distance under the descending 200-day moving average, signaling a longer-term downtrend.
Returning to the S&P 500, the index is trending lower amid recently increased volatility.
From current levels, the June close (3,785) — also the second-quarter close — marks an inflection point. The S&P is back in this area as September’s third-quarter close approaches.
Tactically, a closing violation of the 3,785 area opens the path to a less-charted patch.
Delving deeper, the June gap (3,715) is followed by the 2022 closing low (3,666) and the absolute 2022 low (3,636).
Conversely, the 3,900 mark remains an overhead inflection point, detailed repeatedly.
Recall the September violation of the 3,900 area marks a material “lower low” to punctuate a failed test of the 200-day moving average at the August peak.
More plainly, the S&P 500 has confirmed its longer-term downtrend, and its path of least resistance continues to point lower pending repairs. Tactically, a reversal atop the 3,900 area would mark an early step toward stabilization.
Watch List
Drilling down further, the Dow Transports (TRAN) have reached a potentially consequential technical test.
As illustrated, the group has ventured under major support, tagging 19-month lows, the lowest level since Feb. 2021.
The strong-volume downturn originates from a failed test of the 200-day moving average at the August peak.
Tactically, the breakdown point (12,750) is followed by the post-breakdown peak (13,104). A reversal atop these areas would mark technical progress.
Meanwhile, the Health Care Select Sector SPDR (XLV) has tagged three-month lows.
The prevailing downturn has been fueled by a volume uptick, and originates from the 200-day moving average at the September peak.
Tactically, the breakdown point (124.40) pivots to resistance. A reversal higher would place the group on firmer technical ground.
Beyond the U.S. — Global markets press multi-year lows
Beyond the U.S., influential global markets have reached major technical tests:
To start, the iShares Europe ETF (IEV) has registered 23-month lows, its worst level since Oct. 2020.
The prevailing downturn originates from trendline resistance at the August peak. From current levels, the breakdown point (40.25) pivots to first resistance.
Meanwhile, the iShares MSCI Japan ETF (EWJ) has tagged two-year lows, its worst level since May 2020 amid the height of the pandemic.
Recent weakness punctuates a strong-volume downdraft from trendline resistance.
Tactically, the trendline is descending toward the breakdown point (51.55).
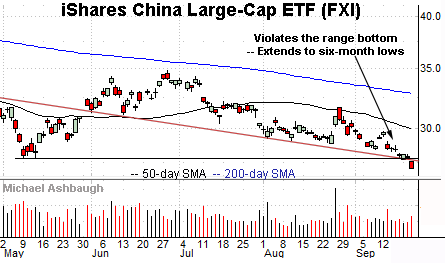
Finally, the iShares China Large-Cap ETF (FXI) has reached six-month lows.
Against this backdrop, consider that Wednesday’s close (27.13) registered fractionally above the March closing low (27.07). A close under this level (27.07) would mark the FXI’s lowest close since March 2009 amid the depth of the financial crisis. (Also see the 18-year chart.)
Tactically, trendline resistance closely matches the breakdown point (27.80). A reversal higher would place the brakes on bearish momentum.


