S&P 500 challenges last-ditch support (3,636) as Volatility Index signals stubborn investor complacency
Focus: Major U.S. benchmarks register 10% downdrafts across just 11 sessions
Technically speaking, an already-bearish bigger-picture backdrop has strengthened amid an aggressive September downdraft.
In the process, the S&P 500 is challenging last-ditch support matching the 2022 low (3,636) even as the Dow Jones Industrial Average has already tagged its worst level since November 2020.
Amid the downturn, market breadth has registered bearish extremes — in the form of two 10-to-1 down days — while market sentiment remains stubborny complacent.
Editor’s Note: As always, updates can be directly accessed at https://chartingmarkets.substack.com.
Before detailing the U.S. markets’ wider view, the S&P 500’s hourly chart highlights the past four weeks.
As illustrated, the S&P has extended its downdraft from the breakdown point (3,900).
The prevailing downturn places major support (3,636) under siege, an area better illustrated on the daily chart.
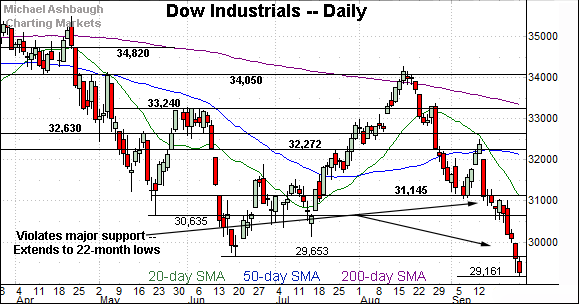
Meanwhile, the Dow Jones Industrial Average has tagged 22-month lows, its worst level since Nov. 2020.
Tactically, the June low (29,653) pivots to first resistance, a level better illustrated on the daily chart.
Tuesday’s early session high (29,659) has registered nearby amid a retest from underneath.
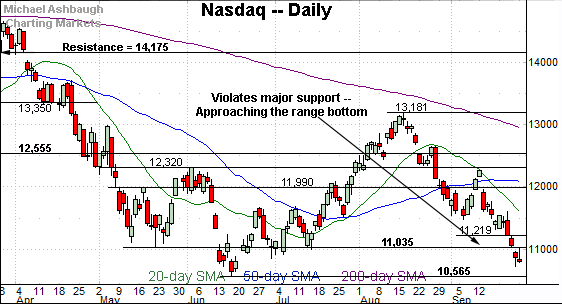
Against this backdrop, the Nasdaq Composite has also extended its downturn.
Tactically, the 11,024-to-11,035 area marks notable resistance — an area detailed previously — and also illustrated on the daily chart below.
Here again, Tuesday’s early session high (11,040) has registered nearby.
Widening the view to six months adds perspective.
On this wider view, the Nasdaq has extended its downdraft from the August peak.
Tactically, the 11,035 area — detailed repeatedly — pivots to first resistance.
To reiterate, Tuesday’s early session high (11,040) has registered nearby.
Conversely, the Nasdaq’s June low (10,565) remains a downside inflection point. This level marks a two-year low, the lowest since Sept. 2020.
Looking elsewhere, the Dow Jones Industrial Average has staged a nearly straightline downdraft from the September peak.
From top to bottom, the index has plunged 3,343 points, or 10.3%, across just 11 sessions.
Tactically, the June low (29,653) pivots to first resistance.
Tuesday’s early session high (29,659) has registered nearby.
Meanwhile, the S&P 500 has plunged to a potentially consequential technical test.
The quality of its rally attempt from the June low (3,636), or lack thereof, should be a useful bull-bear gauge.
Slightly more broadly, the prevailing downturn punctuates a failed test of the breakdown point (3,900) from underneath. (Also see the hourly chart.)
The bigger picture
As detailed above, the major U.S. benchmarks have staged an aggressive September downdraft.
From the September peak to Monday’s low:
The Dow industrials has dropped 3,343 points, or 10.3%.
The Nasdaq Composite has plunged 1,538 points, or 12.5%.
The S&P 500 has dropped 475 points, or 11.5%.
Each benchmark’s downdraft has spanned just 11 sessions. Bearish price action.
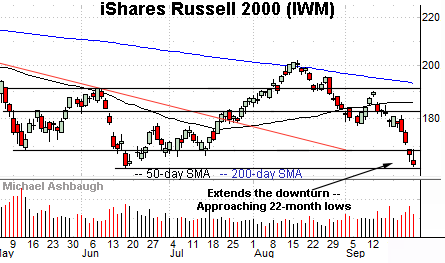
Moving to the small-caps, the iShares Russell 2000 ETF (IWM) has extended lower, pressured amid increased volume.
The prevailing downturn places the June low (162.78) within view, the small-cap benchmark’s lowest level since Nov. 2020. (The September low (163.58) has registered within striking distance.)
Conversely, the 168.90-to-169.20 pivots to first resistance.
Similarly, the SPDR S&P MidCap 400 ETF (MDY) has plunged to its range bottom, pressured amid increased volume.
But in its case, the June low (400.05) has been more firmly challenged, the MDY’s worst level since Nov. 2020.
The September low (400.21) has registered just fractionally higher.
Combined, the small- and mid-cap benchmarks have reached a major technical test. The quality of the rally attempts from the September lows should be a useful bull-bear gauge.
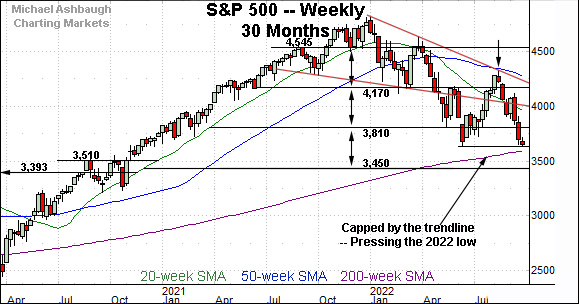
Returning to the S&P 500, this next chart is a weekly view, spanning 30 months. Each bar on the chart represents one week.
As illustrated, the index registered a sizeable third-quarter whipsaw, easily the largest round-trip move on the chart.
The rally attempt stalled at trendline resistance hinged to the S&P 500’s all-time high. (The rally attempt also topped within one point of the 200-day moving average, a level detailed on the daily chart below.)
More immediately, the downturn places the 2022 low (3,636) firmly under siege. This level marks a 21-month low, the S&P 500’s lowest since December 2020.
The S&P’s week-to-date low (3,644) has registered nearby.
More broadly, recall the May downdraft — the violation of the 4,170 support — punctuated a head-and-shoulders top defined by the September 2021, the January 2022 and March 2022 peaks.
That pattern projects to the 3,810 area — which has not held, though it defined the May low (3,810) — and delving deeper, the 3,450 area.
Tactically, the prevailing retest of the 2022 low (3,636) marks a major “watch out.” The quality of the rally attempt from this area is worth tracking.
Market breadth signals ominous backdrop
Moving to the internals, consider that Friday’s market downdraft — to punctuate the S&P 500’s plunge to major support (3,636) — once again registered bearish extremes.
Specifically, NYSE declining volume surpassed advancing volume by a nearly 10-to-1 margin.
This marks the second shoe to drop, following the Sept. 13 downdraft — a nearly 19-to-1 down day — fueled by hotter-than-expected inflation data.
As always, in a textbook world, two 9-to-1 down days — across about a seven-session window — reliably signals a major trend shift. (Or in this case, a potentially aggressive continuation of a prevailing trend.)
In the present case, we have a nearly 10-to-1 down day, and a nearly 19-to-1 down day, across a nine-session window.
More plainly, the recent internal stats are about as textbook bearish as it gets in the real world. (See the Sept. 15 review for added detail on the internals.)
Returning to the six-month view, the S&P 500 has plunged to a potentially consequential technical test.
Against this backdrop, several points stand out:
The prevailing downturn originates from the 200-day moving average, a widely-tracked longer-term trending indicator. The August peak registered within one point of the 200-day. (Also recall the failed trendline test on the weekly chart.)
The September downturn has been fueled by two 10-to-1 down days across a relatively narrow nine-session window.
The prevailing downturn punctuates a massive market whipsaw, effectively spanning the third quarter — July through September.
Against this backdrop, the CBOE Volatility Index signals complacency for the circumstances, positioned comfortably under the 2022 peak.
Combine the details above, and the prevailing backdrop is not promising for market bulls.
The S&P 500 has registered a massive market wind-up — the third-quarter whipsaw — and plunged to challenge 21-month lows amid aggressive selling pressure.
Tactically, the quality of the S&P’s rally attempt from the 2022 low (3,636) should be a useful bull-bear gauge. A reversal atop the 3,810 area would mark technical progress.
Beyond specific levels, the S&P 500’s intermediate- to longer-term bias remains firmly-bearish pending extensive repairs.


