Charting a bearish Q3 technical tilt, S&P 500 rattles cage on major support (3,636)
Focus: U.S. dollar takes flight amid surging Treasury yields, Gold digests a technical breakdown, Financials reach key technical test, TNX, UUP, GLD, XLF
Technically speaking, the major U.S. benchmarks are trending lower, pressured amid surging Treasury yields and jagged price action across asset classes.
Against this backdrop, the S&P 500 is challenging major support (3,636) amid a potentially consequential technical test to conclude the third quarter.
Editor’s Note: As always, updates can be directly accessed at https://chartingmarkets.substack.com.
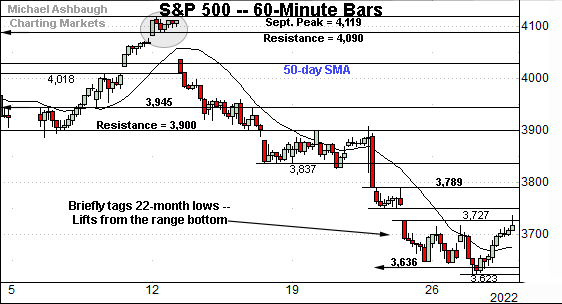
Before detailing the U.S. markets’ wider view, the S&P 500’s hourly chart highlights the past four weeks.
As illustrated, the S&P is digesting a September downdraft.
The initial rally from the range bottom has been flattish, and capped by gap resistance (3,727).
More broadly, recall the prevailing downturn originates from the breakdown point (3,900).
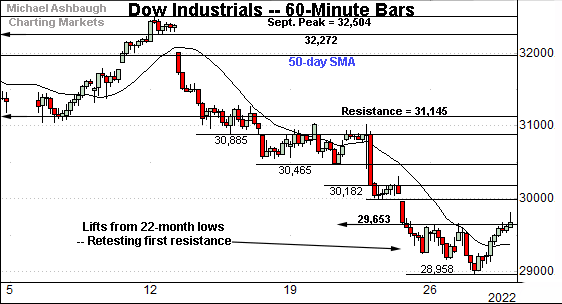
Similarly, the Dow Jones Industrial Average has reversed from 22-month lows.
The initial rally attempt has stalled near first resistance (29,653) — detailed previously — an area also illustrated on the daily chart.
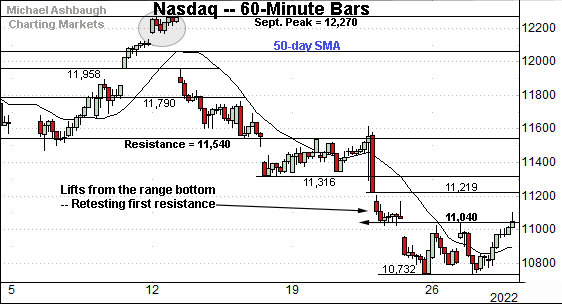
Against this backdrop, the Nasdaq Composite is also traversing a lower plateau.
Here again, the initial rally attempt has stalled near familiar resistance — the 11,035-to-11,040 area — also illustrated on the daily chart below.
Widening the view to six months adds perspective.
On this wider view, the Nasdaq is digesting a downdraft toward the range bottom.
Tactically, the 11,035 area — detailed repeatedly — remains an inflection point. Sustained follow-through atop resistance would mark technical progress.
Conversely, the Nasdaq’s June low (10,565) remains a downside inflection point, a level defining its two-year low.
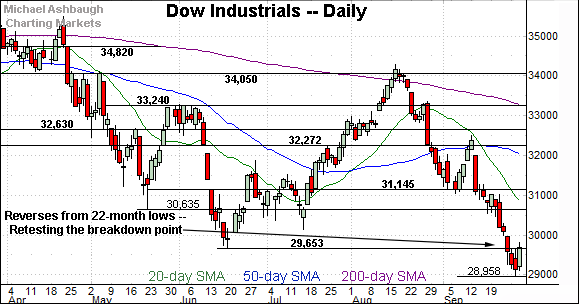
Looking elsewhere, the Dow Jones Industrial Average has staged an aggressive September downdraft.
Tactically, the initial rally attempt has stalled near the breakdown point (29,653) an area defining first resistance.
Wednesday’s close (29,683) registered nearby, and selling pressure has resurfaced.
(By comparison, the prior downturn spanned 3,546 points, or 10.9%, across just 12 sessions.)
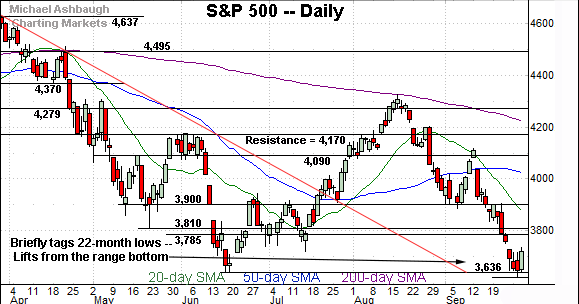
Meanwhile, the S&P 500 is vying to rally after briefly tagging 22-month lows.
Tactically, the June low (3,636) remains an inflection point.
More broadly, recall the prevailing downturn originates from the breakdown point (3,900). (Also see the hourly chart.)
The bigger picture
As detailed above, an already-bearish technical backdrop has strengthened amid a massive third-quarter market whipsaw.
On a headline basis, each major U.S. benchmark has staged an aggressive September downdraft — spanning at least 10% across just 12 sessions — while the subsequent rally attempt, with the benefit of Thursday’s early price action, has faded fast.
Moving to the small-caps, the iShares Russell 2000 ETF (IWM) is vying to rally from its range bottom.
The prevailing upturn punctuates a successful test of the June low (162.78).
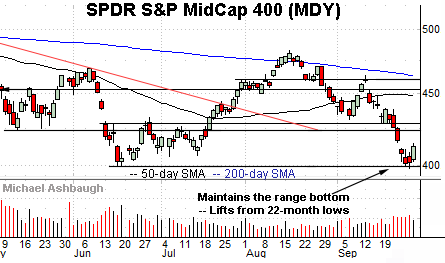
Similarly, the SPDR S&P MidCap 400 ETF (MDY) has reversed from its range bottom.
The initial upturn has been fueled by decreased volume, to punctuate a nominal 22-month low.
Combined, the small- and mid-cap benchmarks have survived potentially significant technical tests — at least so far. An eventual violation of support opens the path to pandemic-era territory.
Returning to the S&P 500’s six-month view, the index is tenuously positioned.
Amid the September plunge, several technical developments stand out:
The prevailing downturn originates from the 200-day moving average, a widely-tracked longer-term trending indicator. The August peak registered within one point of the 200-day. (Also recall the failed trendline test on the weekly chart, detailed Tuesday.)
The September downturn has been punctuated by two 10-to-1 down days across a narrow nine-session window. (Wednesday’s rally marked a 10-to-1 up day, though it was fueled by the Bank of England’s bond-market intervention. Central bank interventions are not bullish.)
The prevailing downturn punctuates a massive market whipsaw, effectively spanning the third quarter — July through September.
Against this backdrop, the CBOE Volatility Index continues to signal complacency for the circumstances, positioned comfortably under the 2022 peak.
So collectively, the S&P 500 is concluding the third quarter (September) on shaky technical footing.
Tactically, a violation of the 2022 low opens the path to potentially significant downside follow-through.
In fact, the third-quarter whipsaw projects to the 3,000 mark. (Start with the August peak, and subtract the June low: 4,325 - 3,666 = 659 points. Then, subtract the result from the breakdown point: 3,666 - 659 = 3,007.)
(Recall a less aggressive downside target projects to the S&P 3,450 area, most recently detailed Tuesday.)
Against this backdrop, the quality of the S&P 500’s rally attempt — to the extent the index tries to rally — is worth tracking. A swift reversal atop the 3,810 area would place the index on firmer technical ground.
Beyond specific levels, the S&P 500’s intermediate- to longer-term bias remains firmly-bearish pending repairs.
Watch List
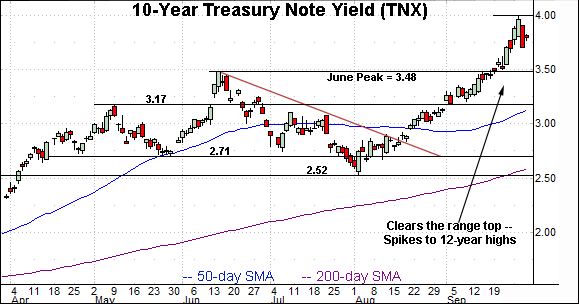
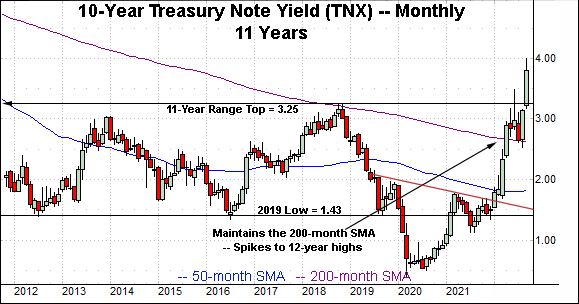
Drilling down further, the 10-year Treasury note yield (TNX) continues to take flight.
As illustrated, the yield has extended a break from its range top (3.25), tagging 12-year highs, its highest level since April 2010.
The prevailing upturn builds on the massive early-2022 trendline breakout, and subsequent sideways range, underpinned by the 200-month moving average.
As detailed previously, the yield’s breakout opens the path to a less-charted patch — and potentially decisive follow-through — a spike that seems to have registered.
(See the Aug. 23 review, amid the yield’s trendline breakout on the daily chart.)
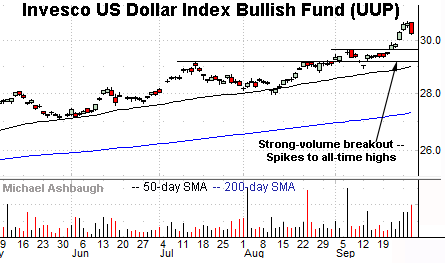
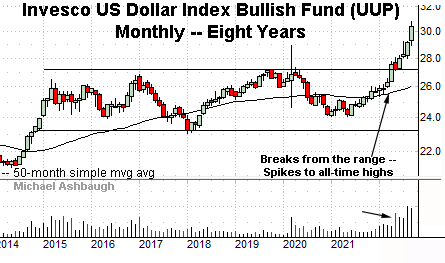
Against this backdrop, the Invesco U.S. Dollar Index Bullish Fund (UUP) — a U.S. dollar proxy — has also taken flight.
Fundamentally, rising interest rates (yields) make a native currency (in this case the dollar) more attractive versus competing currencies, generally sending it higher.
This relationship has held true, sending the shares to all-time highs amid a sustained multi-month volume increase.
The strong dollar presents a headwind for U.S. multinationals — making exports more expensive — but it also pressures commodity prices, which are frequently denominated in U.S. dollars.
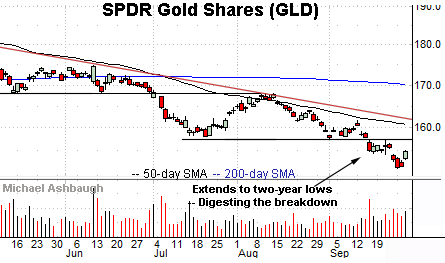
Conversely, the SPDR Gold Shares ETF (GLD) is digesting a downdraft to two-year lows.
As always, gold and the U.S. dollar are inversely correlated.
Tactically, the breakdown point (157.30) is followed by descending trendline resistance closely tracking the 50-day moving average. A reversal atop these areas would place the brakes on bearish momentum.
Beyond the charts, a common bull-case argument contends inflation has likely peaked as signaled by recently plunging commodity prices. Though technically accurate — commodity prices have eased considerably — the surging U.S. dollar has fueled the price downturn.
Put differently, the U.S.-price backdrop and global-price backdrop have diverged in key respects. Slight dislocations are always in play across economies (and currencies), but the current divergence is more pronounced than usual.
(More broadly, see gold’s massive double top, illustrated on the five-year chart.)
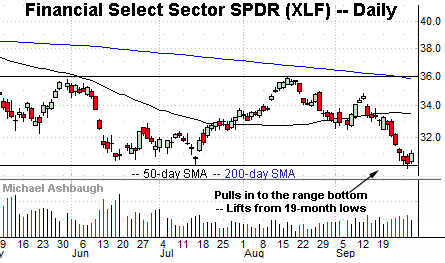
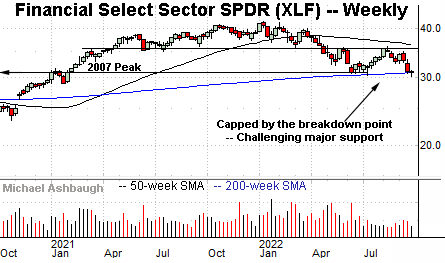
Concluding with one U.S. sector, the Financial Select Sector SPDR (XLF) has reached a potentially consequential technical test.
Specifically, the group is challenging the 200-week moving average (30.78) an area matching the 2007 peak (30.97) as well as the early-2020 highs, immediately preceding the pandemic.
The prevailing downturn orginates from the breakdown point. Tactically, an eventual violation of support opens the path to less-charted territory, and potentially swift follow-through.
(Also see the five-year chart, illustrating the Feb. 2020 pre-pandemic peak — at the time, the group’s all-time high — and subsequent aggressive four-week downdraft.)


