Charting a bull-bear battle, S&P 500 back for second crack at the breakdown point (3,900)
Focus: U.S. dollar takes flight amid gold's death cross, Energy sector tests 200-day average, Apple's trendline breakout, GLD, UUP, USO, XLE, AAPL
Technically speaking, the major U.S. benchmarks are off to a sluggish, but at least modestly positive, July start.
Amid the upturn, the S&P 500 is approaching a potentially consequential test of its breakdown point (3,900) and slightly more distant trendline resistance. The next several sessions may add color.
Editor’s Note: As always, updates can be directly accessed at https://chartingmarkets.substack.com.
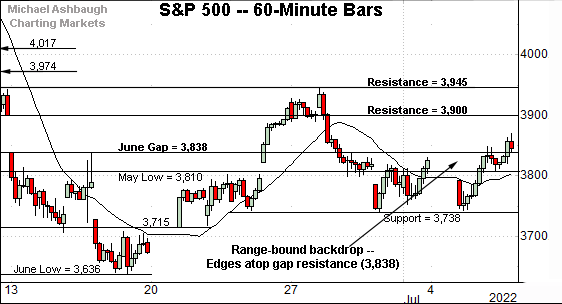
Before detailing the U.S. markets’ wider view, the S&P 500’s hourly chart highlights the past four weeks.
As illustrated, the S&P has ventured atop gap resistance (3,838).
On further strength, recall the more important breakdown point (3,900) matches the top of the gap and the June closing low.
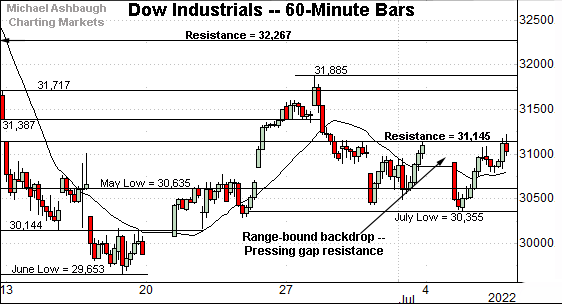
Meanwhile, the Dow Jones Industrial Average is pressing gap resistance (31,145), detailed previously.
Consider that two session highs last week — Wednesday and Friday — registered within seven points of resistance.
On further strength, the top of the June gap (31,387) marks an inflection point.
Against this backdrop, the Nasdaq Composite is also traversing a jagged range.
The prevailing upturn places its first significant resistance (11,560) firmly within striking distance.
Slightly more distant overhead (11,677) is also illustrated below.
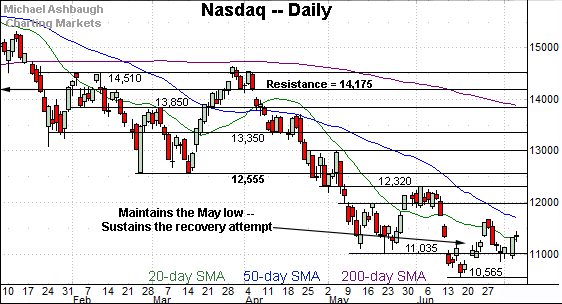
Widening the view to six months adds perspective.
On this wider view, the Nasdaq has thus far sustained a reversal from 21-month lows.
Tactically, the May low (11,035) marks an inflection point.
The June close (11,028) registered nearby preserving a jagged, and still fragile, near-term recovery attempt.
On further strength, the 50-day moving average, currently 11,675, matches the late-June peak (11,677) and is followed by the former range top (11,990). Follow-through atop these areas would strengthen the intermediate-term bull case.
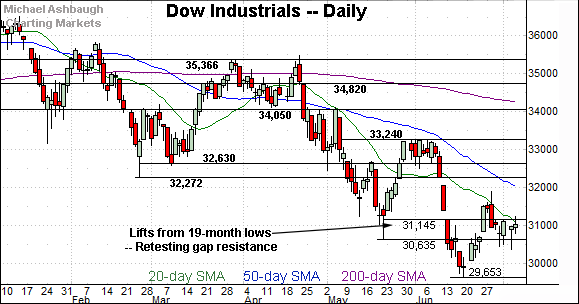
Looking elsewhere, the Dow Jones Industrial Average is vying to rally from 19-month lows.
On further strength, the 50-day moving average, currently 31,964, is descending toward the late-June peak (31,885).
More distant overhead matches the February low (32,272) and gap resistance (32,267), an area also detailed on the hourly chart.
Beyond technical levels, the Dow industrials’ bigger-picture trends remain bearish based on today’s backdrop.
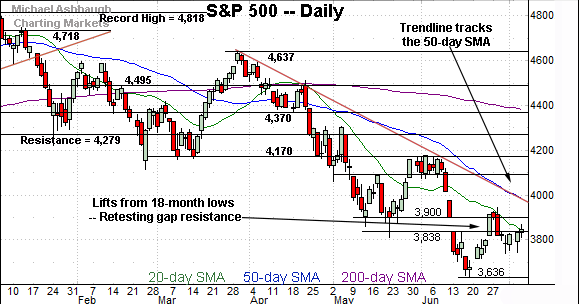
Meanwhile, the S&P 500 is vying to rally from 18-month lows.
From current levels, the breakdown point (3,900) marks major resistance, a level matching the May closing low (3,900) and the top of the June gap (3,900).
More broadly, trendline resistance closely tracks the 50-day moving average, currently 3,977.
The bigger picture
As detailed above, the major U.S. benchmarks are off to a sluggish, but at least slightly positive, July start.
Each big three benchmark has sustained its reversal off the June low, though the prevailing rally attempt gets lackluster marks for style, at best. At least based on today’s backdrop.
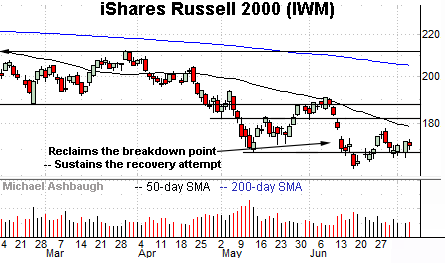
Moving to the small-caps, the iShares Russell 2000 ETF (IWM) has also sustained a lukewarm recovery attempt.
Tactically, the 169.35-to-169.80 area marks notable support.
Conversely, more distant overhead matches the 50-day moving average, currently 178.50, a recent bull-bear inflection point. (Also see the late-June peak (178.15).)
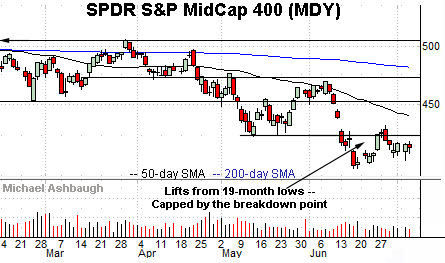
Meanwhile, the SPDR S&P MidCap 400 ETF (MDY) continues to underperform the other widely-tracked U.S. benchmarks.
Tactically, the breakdown point (424.30) remains an overhead hurdle.
Returning to the S&P 500, the index has sustained a thus far lackluster rally off the June low.
Nonetheless, the prevailing recovery attempt is intact barring a violation of the 3,785-to-3,810 area. (The June close and May low.)
Conversely, the June breakdown point (3,900) marks major resistance, detailed previously. Follow-through atop this area would signal waning bearish momentum.
On further strength, trendline resistance closely tracks the 50-day moving average, currently 3,977.
Against this backdrop, the trendline is descending toward the late-June peak (3,945) a level defining a nearly one-month range top. (Also see the hourly chart.)
All told, the latest bear-market rally attempt remains underway.
The S&P 500’s more important bigger-picture trends remain bearish. Eventual follow-through atop S&P 3,945, and trendline resistance, would be cause to reassess.
Beyond technical levels, several bellwether financial names report next week. The markets’ response may add color.
Watch List
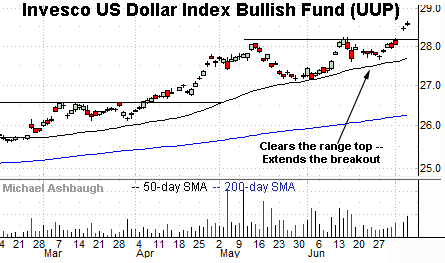
Drilling down further, the Invesco U.S. Dollar Bullish Fund (UUP) — a U.S. dollar proxy — continues to take flight.
Fundamentally, the Federal Reserve’s hawkish policy tilt versus influential central banks — including Europe and Japan — has contributed to persistent dollar strength. As always, higher interest rates make a native currency (in this case the dollar) more attractive versus competing currencies, generally sending it higher.
Technically, the prevailing upturn punctuates a bullish cup-and-handle defined by the May and late-June lows. A near-term target projects to the 28.65 area.
More broadly, the shares have cleared a 14-year range top — illustrated on the monthly chart — opening the path to potentially material upside follow-through.
(Against this backdrop, the euro is holding 20-year lows versus the U.S. dollar and risks dropping below parity with the dollar for the first time in 20 years. Europe is facing a harsher economic headwind than the U.S. amid the Ukraine war and Europe’s related energy crisis.)
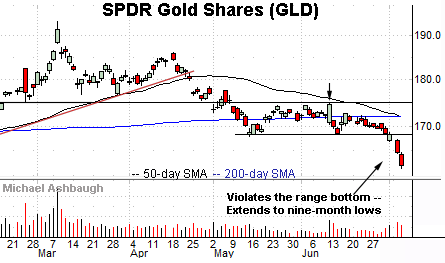
Meanwhile, the SPDR Gold Shares ETF (GLD) — profiled June 2 — has reached nine-month lows. Gold and the U.S. dollar are inversely correlated.
The prevailing downturn builds on the April trendline violation, and punctuates a failed test of resistance (detailed previously) at the June peak.
Tactically, the breakdown point (168.30) pivots to resistance. A reversal higher would strengthen the backdrop.
More broadly, notice gold’s death cross — or bearish 50-day/200-day moving average crossover — an event that has signaled Thursday. Though often a lagging indicator, the crossover signals the intermediate-term downtrend has overtaken the longer-term trend.
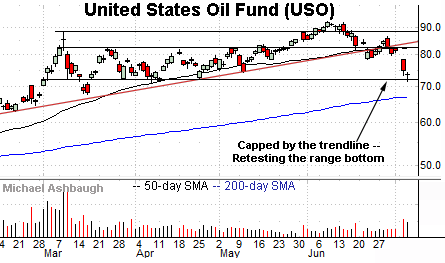
Staying with commodities, the United States Oil Fund (USO) — profiled June 23 — has extended its downturn. The fund tracks the spot price of light, sweet crude oil.
Tecnically, the prevailing downturn builds on the late-June trendline violation.
More immediately, a potentially consequential test of the range bottom — the 72.00 area — remains underway. To reiterate, an eventual violation would mark a material “lower low” opening the path to potentially material incremental downside.
Conversely, gap resistance (78.52) is followed by the 50-day moving average, currently 82.36, a recent bull-bear inflection point. The next several sessions may add color.
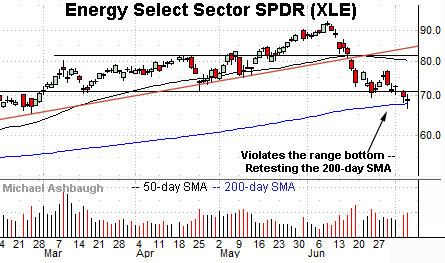
Moving to a U.S. sector, the Energy Select Sector SPDR (XLE) — profiled June 23 — has reached a headline technical test.
Specifically, the group is retesting its 200-day moving average, currently 67.88.
As always, the 200-day is a widely-tracked longer-term trending indicator. So a sustained violation would raise a technical red flag.
Conversely, a swift reversal atop the breakdown point (71.00) would preserve a range-bound backdrop within the group’s primary uptrend.
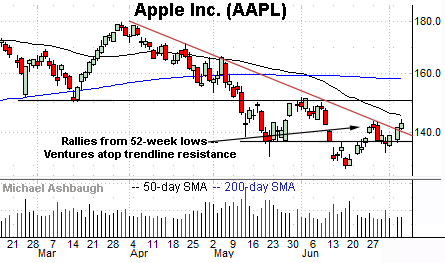
Finally, Dow 30 component Apple, Inc. (AAPL) — profiled last week — is showing signs of life technically.
Specifically, the shares have ventured atop trendline resistance hinged to the April peak.
Tactically, trendline support is followed by the range bottom (137.05). Apple’s recovery attempt is intact barring a violation.
On further strength, the 50-day moving average, currently 145.12, is followed by the firmer breakdown point — the 151.10-to-152.20 area. Follow-through higher would more firmly signal a bullish intermediate-term bias.


