Charting a lukewarm rally attempt, S&P 500 capped by first resistance
Focus: Crude-oil prices violate key trendline, Charting U.S. sub-sector damage, USO, TRAN, XLF, XLP, XLE
Technically speaking, the major U.S. benchmarks have flatlined of late, treading water amid easing commodity prices and Treasury yields.
Against this backdrop, the S&P 500’s latest corrective bounce remains in play — for now — though amid a still comfortably bearish longer-term backdrop.
Editor’s Note: As always, updates can be directly accessed at https://chartingmarkets.substack.com.
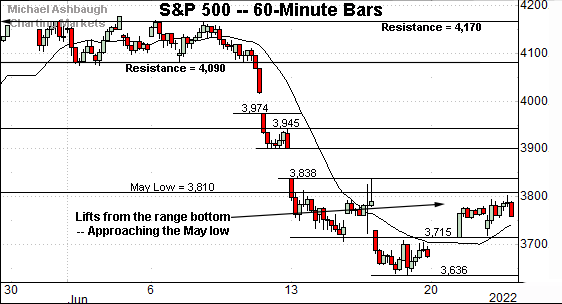
Before detailing the U.S. markets’ wider view, the S&P 500’s hourly chart highlights the past four weeks.
As illustrated, the S&P 500 is traversing a lower plateau.
Tactically, the 3,810-to-3,838 area marks notable overhead, an area also illustrated on the daily chart.
The week-to-date peak (3,801) has registered slightly under resistance.
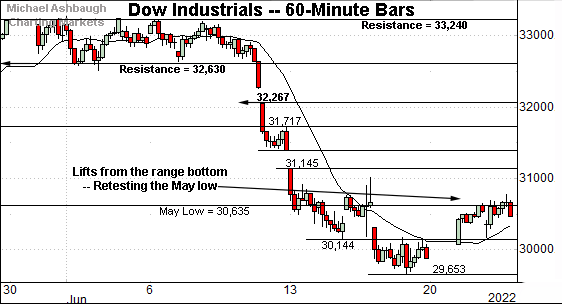
Similarly, the Dow Jones Industrial Average has staged a sluggish bounce from the range bottom.
Tactically, the May low (30,635) remains an overhead inflection point, also detailed on the daily chart.
This area has capped the index on a closing basis, though the week-to-date peak (33,777) has registered slightly above resistance. An extended retest remains in play.
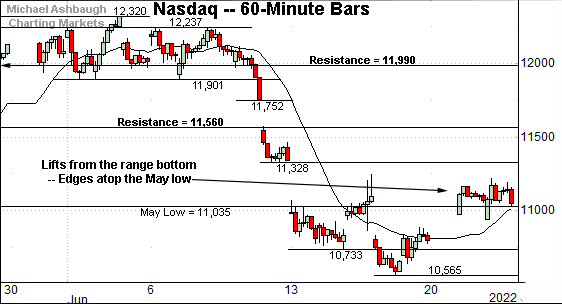
Against this backdrop, the Nasdaq Composite has staged a stronger rally attempt, rising as much as 6.2% off the June low.
(The S&P 500 has rallied as much as 4.5% from the June low, while the Dow industrials have staged a 3.8% rally attempt.)
In the process, the Nasdaq has sustained a slight break back atop the May low (11,035).
On further strength, the post-breakdown peak (11,244) is followed by gap resistance (11,328).
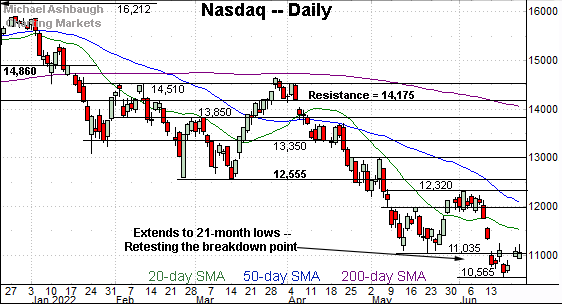
Widening the view to six months adds perspective.
On this wider view, the Nasdaq has reversed from 21-month lows, though the rally attempt remains relatively flat in the broad sweep.
Tactically, the May low (11,035) marks a nearby inflection point. The index has registered consecutive closes slightly higher.
Beyond technical levels, the Nasdaq’s intermediate- to longer-term bias remains firmly-bearish based on today’s backdrop.
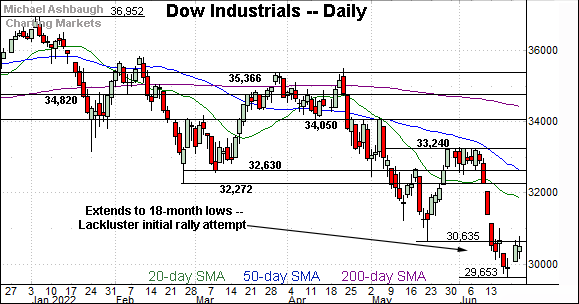
Looking elsewhere, the Dow Jones Industrial Average has reversed from 18-month lows.
The prevailing upturn has thus far been capped by the May low (30,635), an area also detailed on the hourly chart.
More broadly, recall the June downdraft originates from major resistance (33,240), detailed repeatedly.
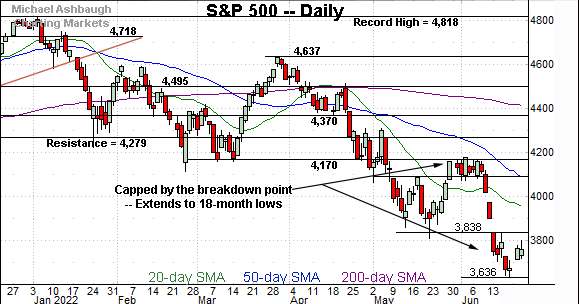
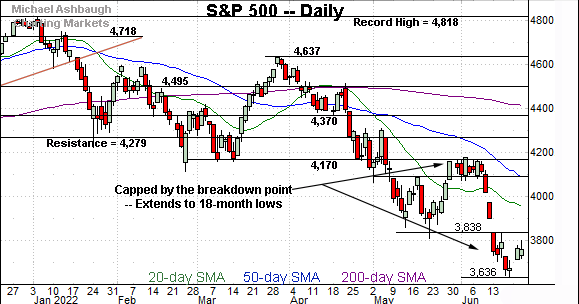
Similarly, the S&P 500 is vying to rally from 18-month lows.
Tactically, the 3,810-to-3,838 area remains notable overhead, and has thus far capped the rally attempt.
The bigger picture
As detailed above, the major U.S. benchmarks’ bigger-picture trends remain bearish.
On a headline basis, the S&P 500 and Dow industrials have pulled in aggressively from major resistance — the S&P 4,170 and Dow 33,240 areas, detailed previously — while the subsequent rally attempt has been comparably flat.
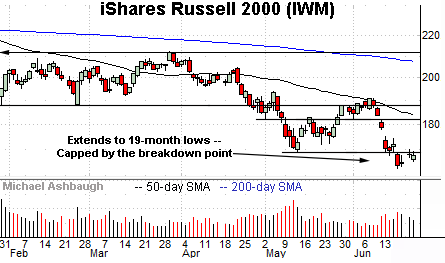
Moving to the small-caps, the iShares Russell 2000 ETF (IWM) is also trending lower.
The aggressive June downdraft originates from the 50-day moving average, and has been punctuated by a sluggish initial rally attempt.
Tactically, a retest of the breakdown point (169.80) remains underway.
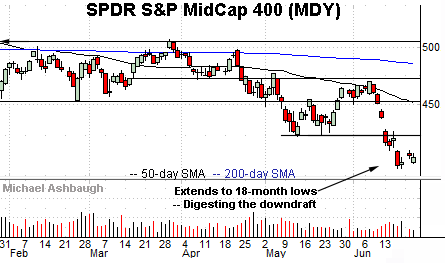
Meanwhile, the SPDR S&P MidCap 400 ETF (MDY) is digesting a downdraft to 18-month lows.
Tactically, gap resistance (413.69) is followed by the firmer breakdown point (424.30). A reversal atop these areas would mark technical progress.
(The week-to-date peak (413.68) has matched the gap.)
Returning to the S&P 500, the six-month view above includes the 20-day Bollinger bands.
Technically, the bands encompass two standard deviations of the S&P 500’s trailing 20-day volatility.
As detailed previously, consecutive closes under the Bollinger bands (also known as volatility bands) signal a tension between time frames.
To start, the sharp downdraft places the S&P outside its “normal” range. A near-term bounce (or reversion to the mean) is to be expected.
But more importantly, the June downdraft has been fueled by extreme bearish momentum — marking a two standard deviation breakdown — likely laying the groundwork for longer-term downside follow-through. See the January and April downdrafts, subsequent flattish rally attempts, and downside follow-through.
Returning to the S&P 500’s conventional six-month view, the chart above includes technical levels and trending indicators.
As illustrated, the index has pulled in aggressively from major resistance (4,170), pressured amid a decisive June technical breakdown.
The subsequent rally attempt, still underway, has thus far been comparably lackluster.
Tactically, the 3,810-to-3,838 area marks notable overhead, also detailed on the hourly chart. Follow-through atop this area would mark technical progress.
Beyond near-term issues, the S&P 500’s longer-term bias remains firmly-bearish pending more extensive repairs.
Watch List
Drilling down further, the United States Oil Fund (USO) has turned lower, pressured amid global-growth concerns. The fund tracks the spot price of light, sweet crude oil.
As illustrated, the shares have ventured under the breakout point (82.40) and trendline support tracking the 50-day moving average.
Tactically, a sustained posture under this area raises the flag to a potential intermediate-term trend shift. The pending retest from underneath will likely add color.
Delving deeper, the May low (74.20) is followed by the firmer range bottom (72.00). An eventual violation would mark a material “lower low” opening the path to potentially material incremental downside.
Charting U.S. sub-sector damage — levels to track
Moving to U.S. sectors, the the Dow Transports (TRAN) has extended its downtrend.
The June downdraft has been fueled by increased volume, and punctuated by a comparably flat rally attempt. Bearish price action.
Tactically, the group’s breakdown point — the 13,440 area — pivots to resistance. An eventual close higher would mark a step toward stabilization.
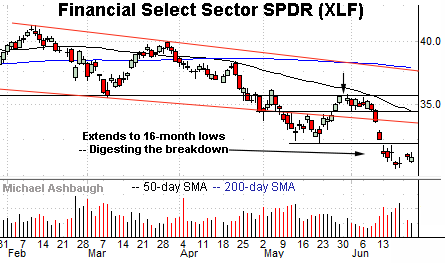
Similarly, the Financial Select Sector SPDR (XLF) is digesting a downdraft to 16-month lows.
Here again, the June pullback has been fueled by increased volume, and punctuated by a flattish rally attempt amid decreased volume.
Tactically, the 32.10-to-32.50 area marks notable overhead. An eventual close higher would mark technical progress.
Combined, the financials and transports are traditional sector leaders. The aggressive June downdrafts, and sluggish subsequent rally attempts, signal a broad-market headwind.
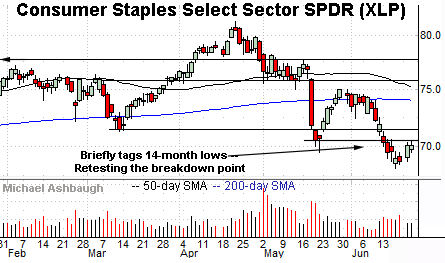
Meanwhile, the Consumer Staples Select Sector SPDR (XLP) — a widely-tracked defensive sector — is also trending lower.
Sector components Coca-Cola Co. (KO), Walmart, Inc. (WMT) and Procter & Gamble Co. (PG) account for a combined 34% ETF weighting. Each is also among the 30 components of the Dow Jones Industrial Average.
Technically, the group is digesting a downdraft to 14-month lows.
From current levels, initial resistance (70.55) is closely followed by the firmer breakdown point (71.45). A sustained rally atop these areas would place the brakes on bearish momentum.
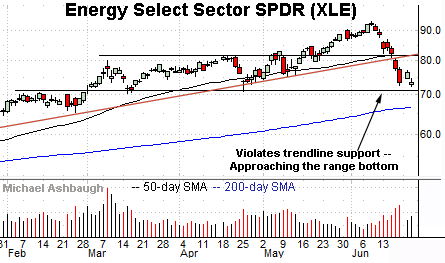
Finally, the Energy Select Sector SPDR (XLE) remains relatively stronger than the other sectors.
Still, the group has violated trendline support — amid a volume spike — and staged a subsequently sluggish rally attempt.
Tactically, the prevailing range broadly spans from 71.00 to 81.50. The eventual break from this range likely signals the group’s next material move.
Against this backdrop, a violation of the range bottom (71.00) likely opens the path to the 200-day moving average, currently 66.84. The energy sectors are the only widely-tracked groups still positioned atop the 200-day moving average.


