Charting a bull-bear stalemate, S&P 500 nails major resistance (4,170)
Focus: Apple challenges the breakdown point, Gold and silver reach key tests, China's trendline breakout, Emerging markets' breakout attempt, AAPL, GLD, SLV, FXI, EEM
Technically speaking, the major U.S. benchmarks are vying to stabilize in the wake of a respectable rally off the May low.
Against this backdrop, the S&P 500 has effectively nailed major resistance (4,170), thus far topping just two points lower amid a bull-bear stalemate.
Editor’s Note: As always, updates can be directly accessed at https://chartingmarkets.substack.com.
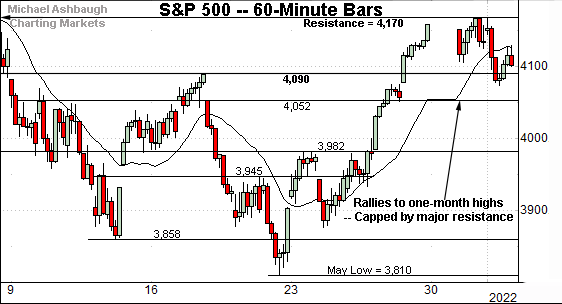
Before detailing the U.S. markets’ wider view, the S&P 500’s hourly chart highlights the past four weeks.
As illustrated, the S&P has tagged one-month highs.
Still, the prevailing upturn has thus far been capped by major resistance (4,170), detailed repeatedly.
The week-to-date peak (4,168) — established Tuesday — has registered nearby. Upside follow-through atop resistance would likely open the path to a higher plateau.
Similarly, the Dow Jones Industrial Average has reached one-month highs.
But here again, the rally has also been capped by next resistance (33,240), an area detailed previously. (See for instance, the May 20 review.)
Tuesday’s session high (33,240) precisely matched resistance to conclude May. The pending selling pressure in this area, or lack thereof, may add color.
Against this backdrop, the Nasdaq Composite has also registered one-month highs.
Tactically, recall the breakout point — 11,990 area — pivots to support.
Wednesday’s session close (11,994) registered nearby amid an extended retest.
Widening the view to six months adds perspective.
On this wider view, the Nasdaq is vying to escape the mid-May range. The prevailing three-session range — to conclude May, and start June — punctuates a bull flag hinged to the steep late-May rally.
As always, the bull flag is a continuation pattern. Tactically, a sustained posture atop the 11,990 area preserves the prevailing rally attempt.
More broadly, the Nasdaq’s breakdown point (12,555) marks major resistance. The 50-day moving average, currently 12,806, is descending toward the breakdown point. Follow-through atop these areas would strengthen the intermediate-term bull case.
Looking elsewhere, the Dow Jones Industrial Average has rallied more aggressively from the May low.
In the process, the Dow has reclaimed its breakdown point — the 32,630 area — and sustained a posture slightly higher.
To reiterate, the prevailing near-term rally attempt is intact barring a violation of the 32,630 area.
More broadly, eventual follow-through atop the 50-day moving average, currently 33,520, might strengthen the intermediate-term outlook.
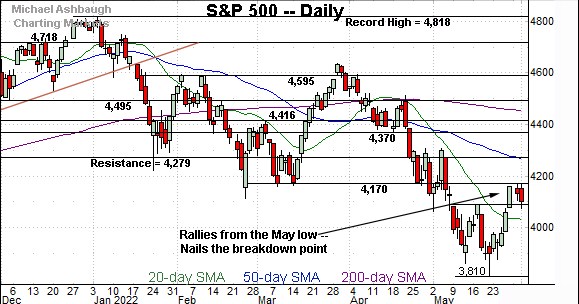
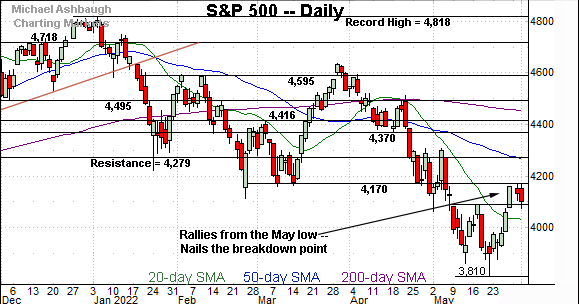
Meanwhile, the S&P 500 has effectively tagged its breakdown point.
To reiterate, the week-to-date peak (4,168) has closely matched major resistance (4,170) a bull-bear inflection point, detailed repeatedly.
Conversely, the 4,090 area pivots to near-term support.
The bigger picture
As detailed above, the major U.S. benchmarks are vying to stabilize in the wake of a respectable rally off the May low.
Against this backdrop, the S&P 500 has tagged major resistance (4,170) and the initial retest has concluded with a bull-bear stalemate.
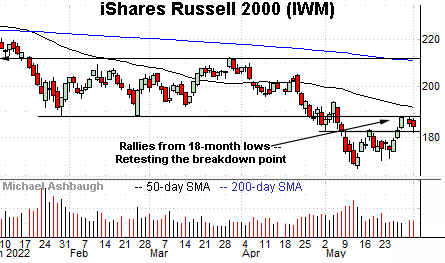
Moving to the small-caps, the iShares Russell 2000 ETF (IWM) is pressing its breakdown point — the 187.90-to-188.10 area.
Follow-through atop resistance would mark technical progress.
Conversely, the 182.60 area pivots to support, and is followed by the week-to-date low (181.77).
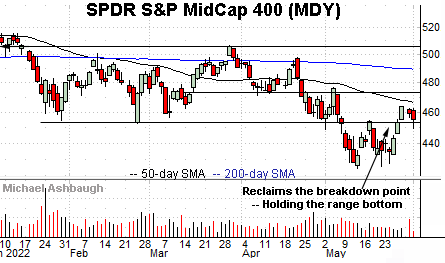
Meanwhile, the SPDR S&P MidCap 400 ETF (MDY) has reclaimed its breakdown point (452.90).
On further strength, the 50-day moving average, currently 466.10, is followed by the 473.30 area.
More broadly, the MDY’s backdrop resembles that of the Dow industrials in notable respects.
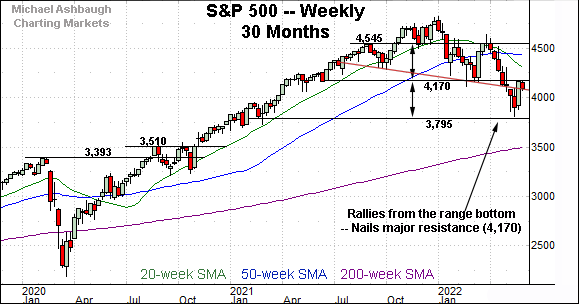
Returning to the S&P 500, this next chart is a weekly view, spanning 30 months. Each bar on the chart represents one week.
Recall the May downdraft opened the path to the S&P 500’s lower plateau. A downside projected to the 3,800 area. (See the April 29 review.)
The May low (3,810) — established May 20 — registered near the target and the S&P 500 has rallied respectably.
More immediately, the prevailing rally attempt has thus far been capped by major resistance (4,170), detailed repeatedly. (See for instance, the May 16 review.)
In fact, the rally attempt has thus far peaked at 4,168 — see Tuesday’s session high — closely matching resistance. Follow-through atop this area would mark notable progress.
Returning to the six-month view, the S&P 500 is digesting a sharp reversal off the May low.
Recall the initial rally spanned as much as 9.1%, across just six sessions, originating from the May low, near the 3,800 target.
The aggressive rally has thus far concluded with a bull-bear stalemate.
Market bears have defended the 4,170 resistance, capping the rally at the S&P’s first significant hurdle.
Nonetheless, the initial selling pressure near resistance has registered as tame in the 2022 market context.
Tactically, the prevailing recovery attempt is intact barring a closing violation of the former range top (4,090).
More broadly, the S&P’s bigger-picture trends remain bearish pending more extensive repairs. As always, it’s not just what the markets do, it’s how they do it.
Editor’s note: The next review will be published Tuesday.
Watch List
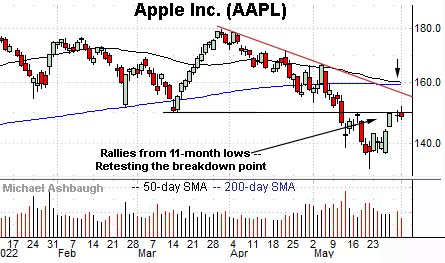
Drilling down further, Dow 30 component Apple, Inc. (AAPL) has reached a headline technical test.
Specifically, the shares are retesting the breakdown point (150.10), a bull-bear inflection point detailed previously. (See the May 12 review.)
Tactically, an eventual close atop the 150 area would mark technical progress. Upside follow-through atop trendline resistance would more firmly signal a trend shift.
Separately, notice the pending death cross, or bearish 50-day/200-day moving average crossover. Though frequently a lagging indicator, the crossover signals the intermediate-term downtrend has overtaken the longer-term trend.
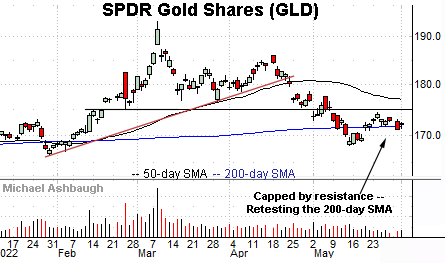
Looking elsewhere, the SPDR Gold Shares ETF (GLD) has reached a notable test.
Specifically, the shares are hugging the 200-day moving average, currently 171.80, a widely-tracked longer-term trending indicator.
The prevailing retest punctuates a lackluster late-May rally attempt, laying the groundwork for potential downside follow-through.
Tactically, the late-May peak (174.40) is followed by the 50-day moving average, currently 176.88. Follow-through atop these areas would place the shares on firmer technical ground.
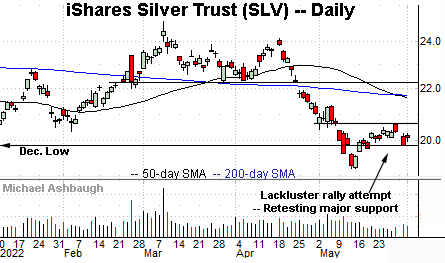
Similarly, the iShares Silver Trust (SLV) — profiled May 12 — remains tenuously positioned.
Broadly speaking, major support spans from about 19.83 to 20.40, levels matching the December low and a nearly two-year range bottom, illustrated on the weekly chart.
The May close (19.84) matched support amid an extended retest.
Tactically, an eventual violation opens the path to a less-charted patch, and potentially material downside follow-through. Conversely, a sustained reversal atop the 20.40 area would place the shares on firmer ground.
Beyond the U.S., the iShares China Large-Cap ETF (FXI) has come to life technically.
Specifically, the shares have cleared trendline resistance closely tracking the 50-day moving average, currently 30.92.
Against this backdrop, an extended test of the early-May peak (31.69) remains underway. As detailed previously, upside follow-through would punctuate a “higher high” confirming the recent trend shift. (See the May 18 review.)
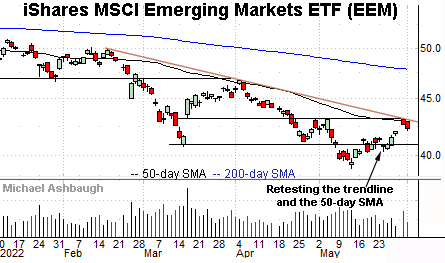
Finally, the iShares MSCI Emerging Markets ETF (EEM) has reached a key technical test.
As illustrated, the shares are challenging trendline resistance closely tracking the 50-day moving average, currently 42.86.
Tactically, the trendline is closely followed by the May range top, an area matching the March gap (43.30). A sustained rally atop resistance would raise the flag to a trend shift.


