S&P 500's bear-market rally attempt clashes with major resistance (3,900)
Focus: Apple and Amazon challenge key trendlines, FedEx and IBM exhibit relative strength
Technically speaking, the major U.S. benchmarks are vying to sustain a recovery attempt as Thursday’s second-quarter close approaches.
Against this backdrop, the prevailing technicals — as measured by price action, market breadth and sentiment — are not consistent with the view that a bear-market low has been established.
Editor’s Note: As always, updates can be directly accessed at https://chartingmarkets.substack.com.
Before detailing the U.S. markets’ wider view, the S&P 500’s hourly chart highlights the past four weeks.
As illustrated, the S&P has filled the first mid-June gap.
Consider that Monday’s close (3,900.11) closely matched gap resistance (3,900.16).
On further strength, the post-breakdown peak (3,945) marks additional overhead, detailed previously.
Tuesday’s early session high (3,945) matched resistance.
Similarly, the Dow Jones Industrial Average has filled the mid-June gap.
More broadly, the index is traversing a less-charted patch also illustrated on the daily chart.
Tactically, gap support (31,145) is followed by a firmer floor matching the May low (30,635).
Against this backdrop, the Nasdaq Composite’s rally attempt remains slightly stronger. The index has reached the second June gap, outpacing the S&P 500 and Dow industrials.
Nonetheless, the index has thus far balked at its first significant resistance (11,560), detailed previously. A retest of this area remains underway.
Widening the view to six months adds perspective.
On this wider view, the Nasdaq has extended a rally from 21-month lows.
In the process, the index has reached a nearly 1,000-point range, roughly spanning from the 11,000 mark to the 12,000 mark. (The precise range is slightly narrower, from 11,035 to 11,990.)
Against this backdrop, the 50-day moving average, currently 11,915, has reached the range top. Follow-through atop this area would strengthen the intermediate-term bull case.
Looking elsewhere, the Dow Jones Industrial Average has knifed from 18-month lows, reaching a less-charted patch. Tactically, the May low (30,635) marks a downside inflection point.
More broadly, recall the initial June downturn originates from major resistance (33,240), detailed repeatedly.
Meanwhile, the S&P 500 has also reversed to the former range — at least sort of.
On a positive note, the S&P has reclaimed first resistance in the 3,810-to-3,838 area.
Still, the index has thus far struggled with resistance matching its former significant closing low (3,900). The precise level matches the May closing low (3,900.79).
Notably, the 4,170 resistance marked the prior comparable hurdle. The failed retest from underneath concluded with pronounced downside follow-through.
This makes the prevailing retest of the 3,900 mark worth tracking.
The bigger picture
As detailed above, the major U.S. benchmarks are vying to sustain a recovery attempt as Thursday’s second-quarter close approaches.
Though each benchmark has rallied respectably, the prevailing technicals — as measured by price action, market breadth and market sentiment — are not consistent with the view that the major benchmarks have established the bear-market low.
Moving to the small-caps, the iShares Russell 2000 ETF (IWM) has reversed from 19-month lows, rising amid largely decreased relative volume.
Tactically, the range bottom (169.80) pivots to support.
Conversely, more distant overhead matches the 50-day moving average, currently 181.66, a recent bull-bear inflection point.
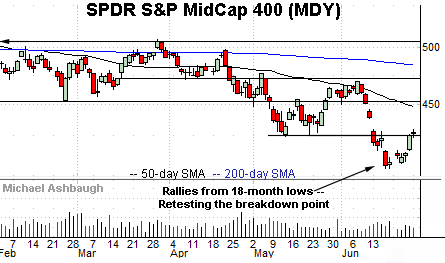
Meanwhile, the SPDR S&P MidCap 400 ETF (MDY) is vying to rally from 18-month lows.
Tactically, a retest of the breakdown point (424.30) remains underway.
More broadly, the small- and mid-cap benchmarks’ bigger-picture trends remain bearish based on today’s backdrop.
Returning to the S&P 500, the index has reached a notable technical test. Specifically, the 3,900 mark is shaping up as potentially significant resistance.
At the risk of getting too granular, consider the following levels:
The May closing low (3,900.79).
The June gap (3,900.16).
The mid-June closing low, effectively matching the June gap (3,900.86).
Monday’s close (3,900.11).
As a market technician with a general distaste for round numbers, the details above are a challenge. Anyone can point to a round number. Nonetheless, the levels are there, and the 3,900 area marks an inflection point.
Tactically, follow-through atop the 3,900 mark would prolong the bear-market rally attempt.
And on further strength, consider that a 10% rally from the June low would place the S&P 500 precisely on the 4,000 mark. (Start with the June low: 3,636.9 * 1.10 = 4,000.6. Another round number!)
Beyond technical levels, the prevailing upturn has been punctuated by less-than-stellar market breadth for the prevailing conditions. The recent internals would not conventionally support a stake-in-the-ground bullish reversal sufficient to define the market low.
Combine this with a sentiment backdrop — as measured by the CBOE Volatility Index (VIX) — that remains stubbornly complacent for the prevailing conditions, and the S&P 500’s bigger-picture trends remain bearish.
Looking ahead, the June close (Thursday) also concludes the second quarter and the 2022 first-half. The next several sessions may add color.
Watch List — Amazon and Apple challenge key trendlines
Drilling down further, Amazon.com, Inc. (AMZN) has reached a headline technical test.
Specifically, the shares are challenging trendline resistance roughly tracking the 50-day moving average, currently 119.40.
Tactically, the prevailing upturn punctuates a successful test of the range bottom (the May low), which is constructive.
Still, the rally has been fueled by decreased volume, while Amazon’s relative strength index (RSI, not illustrated) has concurrently registered a “lower high.” These traits reduce the chances of a trendline breakout.
On further strength, major resistance matches the late-April gap (130.76). Eventual follow-through would punctuate a double bottom — the W formation, defined by the May and June lows — more firmly signaling a trend shift.
Similarly, Dow 30 component Apple, Inc. (AAPL) is challenging a relatively well-defined trendline.
Here again, recent strength has been fueled by decreased volume — while Apple’s relative strength index (RSI, not illustrated) has thus far registered a “lower high” — reducing the chances of a trendline breakout.
Separately, Apple registered a “lower low” versus the May low — (unlike Amazon) — signaling an intact downtrend based on today’s backdrop.
Tactically, trendline resistance is followed by the firmer breakdown point — the 151.10-to-152.20 area. An eventual break atop this area would signal a bullish intermediate-term bias.
IBM and FedEx exhibit relative strength
Moving to pockets of strength, International Business Machines Corp. (IBM) — profiled June 9 — is acting well technically.
As illustrated, the shares have rallied to the range top, rising to challenge 52-week highs. The prevailing upturn punctuates a successful test of the 50-day moving average.
Tactically, a near-term target projects to the 149.00 area on follow-through.
Conversely, the former range top (139.30) is followed by the ascending 50-day moving average, currently 136.20. IBM’s breakout attempt is intact barring a violation.
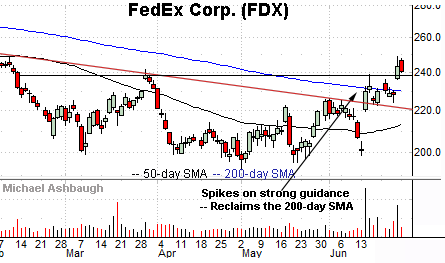
Finally, transportation sector bellwether FedEx Corp. (FDX) has also come to life.
Late last week, the shares gapped to four-month highs, rising after the company issued stronger-than-expected guidance despite reporting a slight third-quarter earnings miss.
The strong-volume spike places the shares atop the 200-day moving average, and builds on a mid-June trendline breakout.
Tactically, the breakout point (238.60) is followed by the 200-day moving average, currently 230.30, and slightly deeper trendline support. The prevailing rally attempt is intact barring a violation.


