S&P 500's rally attempt pauses as 10-year yield pulls in to key technical test
Focus: 10-year yield pulls in to 50-day moving average (?!) as global-market cross currents persist, TNX, IEV, EWJ, FXI
Technically speaking, the major U.S. benchmarks continue to trend broadly lower amid still largely bearish bigger-picture price action.
Amid the cross currents, the S&P 500 is pacing its worst first-six-month performance — January through June — since 1970. The charts below add color:
Editor’s Note: As always, updates can be directly accessed at https://chartingmarkets.substack.com.
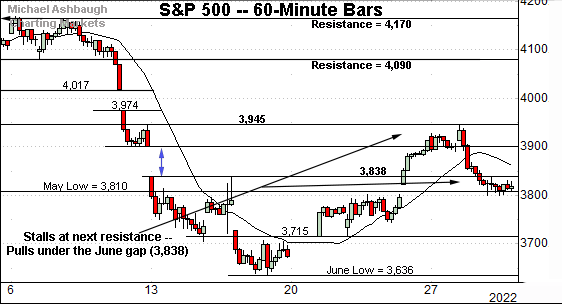
Before detailing the U.S. markets’ wider view, the S&P 500’s hourly chart highlights the past four weeks.
As illustrated, the S&P has thus far balked at next resistance (3,945) detailed previously.
The week-to-date peak (3,945) has matched resistance.
Separately, the prevailing pullback places the index back under familiar gap resistance (3,838).
Wednesday’s session high (3,836) registered nearby.
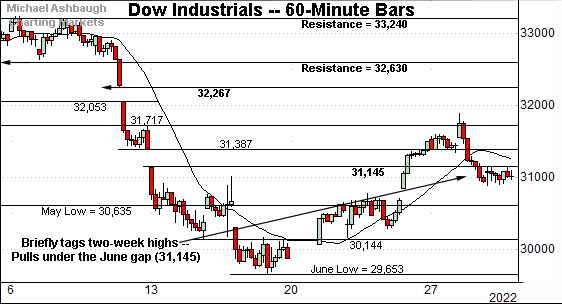
Similarly, the Dow Jones Industrial Average has pulled in from two-week highs.
Here again, the downturn places it back under gap resistance (31,145).
Wednesday’s session high (31,153) registered nearby.
Delving deeper, the May low (30,635) marks a notable floor, an area also detailed on the daily chart.
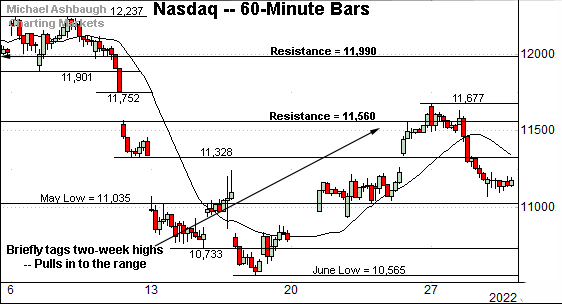
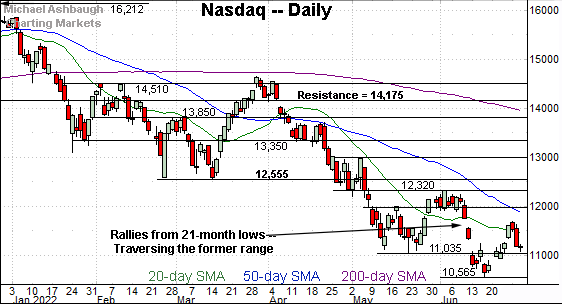
Against this backdrop, the Nasdaq Composite is also traversing an unsually wide range.
The recent rally attempt has thus far stalled in the vicinity of its first significant resistance (11,560).
Widening the view to six months adds perspective.
On this wider view, the Nasdaq is vying to sustain a rally from 21-month lows.
Recall the prevailing range spans nearly 1,000 points, from about the 11,000 mark to the 12,000 mark. (The precise range spans from 11,035 to 11,990.)
On further strength, the 50-day moving average, currently 11,818, is followed by the range top (11,990). Follow-through atop this area would strengthen the intermediate-term bull case.
Looking elsewhere, the Dow Jones Industrial Average has reached a less-charted patch, rising from 18-month lows.
On further strength, the February low (32,272) closely matches gap resistance (32,267), an area also detailed on the hourly chart.
Conversely, the May low (30,635) marks a downside inflection point.
Beyond technical levels, the Dow industrials’ bigger-picture trends remain bearish based on today’s backdrop.
Meanwhile, the S&P 500 has staged a technically less impressive rally attempt.
Recall the upturn has stalled near the breakdown point, a level defined by the May closing low (3,900) and the top of the June gap (3,900).
More immediately, the bottom of the gap (3,838) has marked a hurdle, also detailed on the hourly chart.
The bigger picture
As detailed above, the major U.S. benchmarks continue to trend broadly lower. Each benchmark has staged a thus far lackluster rally attempt from the June low.
Against this backdrop, the S&P 500 is poised to conclude its worst first-six-month performance — January through June — since 1970.
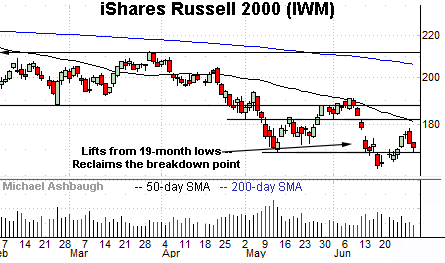
Moving to the small-caps, the iShares Russell 2000 ETF (IWM) has reversed from 19-month lows.
Tactically, the range bottom (169.80) pivots to support.
On further strength, more distant overhead matches the 50-day moving average, currently 180.40, a recent bull-bear inflection point.
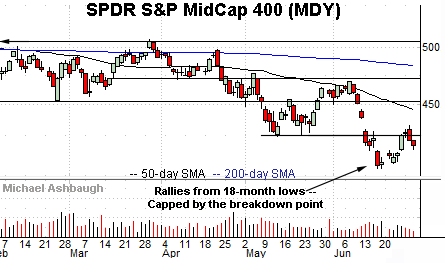
Meanwhile, the SPDR S&P MidCap 400 ETF (MDY) has rallied less aggressively from 18-month lows.
As illustrated, the MDY remains capped by its breakdown point (424.30).
More broadly, the small- and mid-cap benchmarks’ bigger-picture trends remain bearish.
Returning to the S&P 500, the index started June with a technical breakdown, plunging from major resistance (4,170)
The downdraft punctuated a failed retest of the breakdown point (4,170).
Fast forward to the present, and the S&P has struggled to reclaim its corresponding June breakdown point (3,900), detailed previously.
So tactically, eventual follow-through atop the 3,900-to-3,945 area might be noteworthy. (Also see the hourly chart.)
Beyond near-term issues, the S&P 500’s bigger-picture trends remain bearish pending more extensive repairs. As always, it’s not just what a benchmark does, it’s how it does it.
Editor’s Note: The next review will be published Thursday, July 7. The U.S. markets are closed Monday, July 4. Have a great long holiday!
Watch List — 10-year Treasury note yield reaches key test
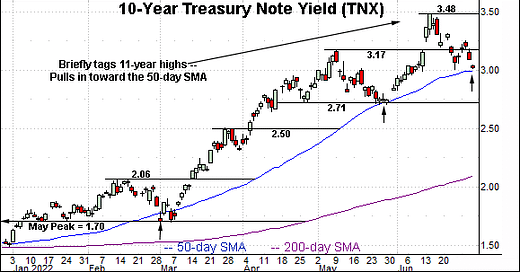
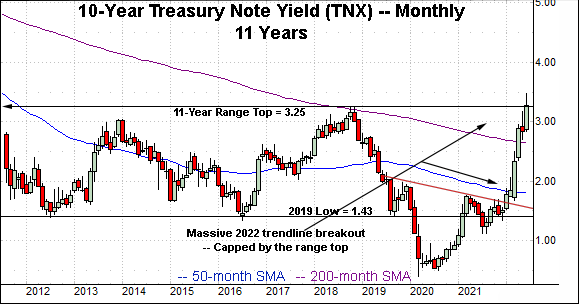
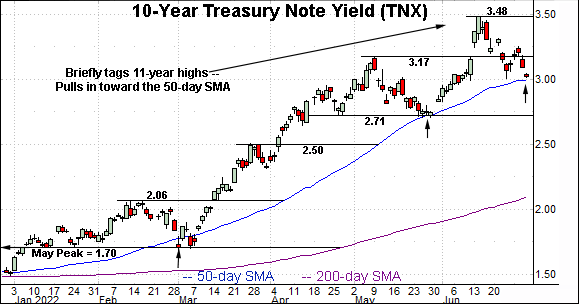
Drilling down further, the 10-year Treasury note yield (TNX) has pulled in respectably from 11-year highs.
The prevailing downturn places it within view of the 50-day moving average, currently 2.99. As always, the 50-day is a widely-tracked intermediate-term trending indicator.
Tactically, recall the 50-day moving average underpinned the May low, an area from which the steep early-June spike originated. Similarly, the massive three-month spike from the March low originated near the 50-day moving average.
So a sustained violation of the 50-day moving average would raise a question mark, placing the yield’s powerful intermediate-term uptrend in doubt.
More broadly, recall the 2018 peak (3.25) marks an overhead inflection point, detailed on the monthly chart.
The yield has yet to register a weekly close atop the 2018 peak. (The mid-June weekly close (3.24) effectively matched the range top.)
Combined, the prevailing backdrop suggests an unexpected range-bound chopping around phase may be pending. Nonetheless, eventual upside follow-through — atop the 3.25 mark — remains a “watch out.” Such a move opens the path to potentially significant incremental upside. The July start will likely add color.
(On a granular note, the yield’s early-June spike marked a two standard deviation breakout, punctuated by consecutive closes atop the 20-day Bollinger bands. The aggressive upturn improves the chances of upside follow-through following a cooling-off period.)
Global market cross currents persist
Beyond the U.S., the iShares Europe ETF (IEV) is digesting a downdraft to 20-month lows.
The prevailing pullback originates from trendline resistance roughly tracking the 50-day moving average.
Tactically, the breakdown point (44.40) pivots to resistance. A rally atop this area would mark a step toward stabilization.
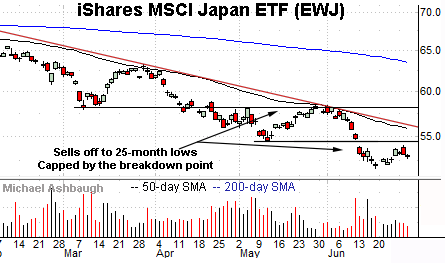
Meanwhile, the iShares MSCI Japan ETF (EWJ) is digesting a downdraft to 25-month lows.
Here again, the downturn originates from trendline resistance, in this case, very closely tracking the 50-day moving average.
Tactically, the breakdown point (54.55) pivots to resistance.
Combined, Europe and Japan have registered aggressive June downdrafts, punctuated by comparably flat rally attempts. Bearish price action. (The S&P 500’s June backdrop generally mirrors that of Japan and Europe.)
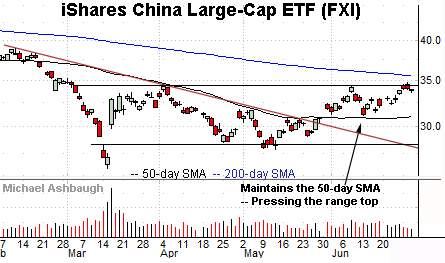
Finally, the iShares China Large-Cap ETF (FXI) — profiled June 2 — continues to diverge from most other global markets.
As illustrated, the shares are challenging nearly four-month highs, rising from a modified head-and-shoulders bottom defined by the March, May and June lows.
More broadly, recent strength builds on a trendline breakout, as Europe and Japan concurrently failed trendline tests. Tactically, the prevailing rally attempt is intact barring a violation of the 31.10-to-31.30 area.
Editor’s Note: The next review will be published Thursday, July 7. The U.S. markets are closed Monday, July 4. Have a great long holiday!

