Bullish momentum accelerates, Nasdaq knifes to nine-month highs
Focus: Nasdaq stages two standard deviation breakout, Small- and mid-caps clear key trendlines
Broadly speaking, the bigger-picture technicals remain bullish, on balance, despite a backdrop that is not one-size-fits-all.
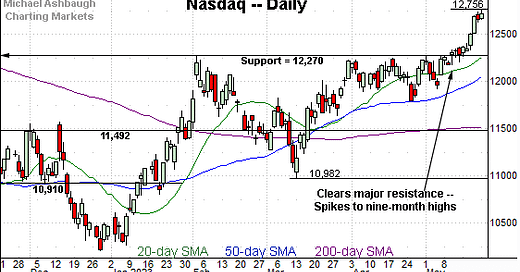
On a headline basis, the Nasdaq Composite has taken flight, knifing to nine-month highs amid statistically unusual momentum.
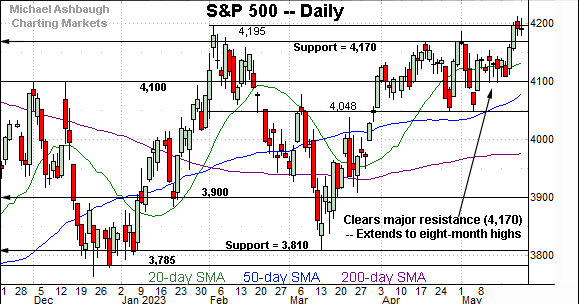
Meanwhile, the S&P 500 has ventured atop major resistance (4,170) amid a less impressive pulling-teeth breakout attempt. The charts below add color:
Editor’s Note: As always, updates can be directly accessed at https://chartingmarkets.substack.com.
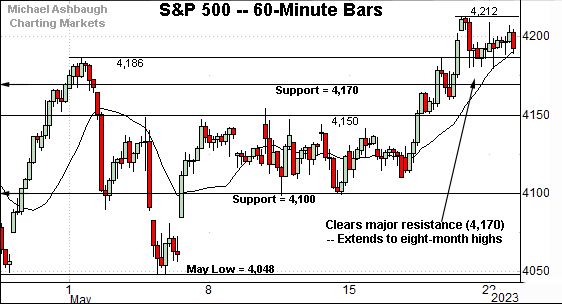
Before detailing the U.S. markets’ wider view, the S&P 500’s hourly chart highlights the past four weeks.
As illustrated, the S&P 500 has broken out, rising to tag eight-month highs.
The prevailing upturn originates from major support (4,100) an area also detailed on the daily chart.
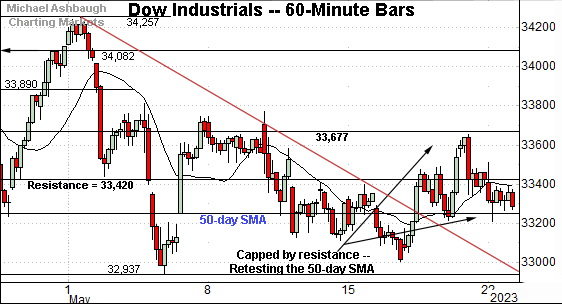
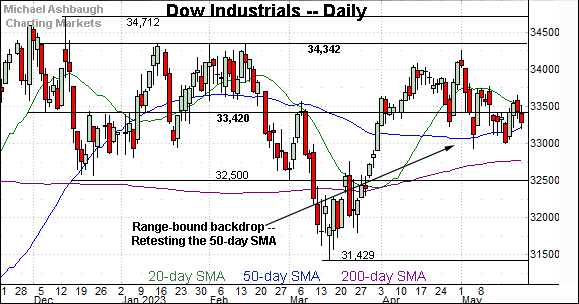
Meanwhile, the Dow Jones Industrial Average continues to lag firmly behind.
Tactically, the recent upturn has been capped by resistance (33,677), detailed previously. The mid-May peak (33,653) has registered nearby.
More immediately, the latest retest of the 50-day moving average, currently 33,250, remains underway.
Against this backdrop, the Nasdaq Composite has taken flight.
Tactically, the index has knifed to nine-month highs, placing distance atop major resistance (12,270).
More broadly, the prevailing upturn originates from the May low (11,925) matching familiar support (11,924) detailed previously. (See the May 3 review.)
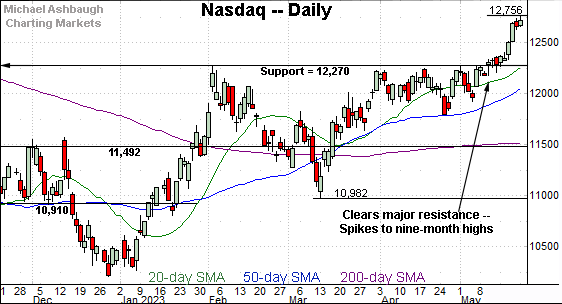
Widening the view to six months adds perspective.
On this wider view, the Nasdaq has knifed atop major resistance (12,270), an area defined by the Sept. peak (12,270) and Feb. peak (12,269).
Tactically, the 12,570 area marks a near-term floor — also detailed on the hourly chart — roughly matching the Q1 2022 low of 12,555. (See the April 20 review.)
Delving deeper, the breakout point (12,270) pivots to major support.
(On a granular note, the Nasdaq’s May spike marks a two standard deviation breakout, punctuated by a single close atop the 20-day volatility bands. As always, consecutive closes atop the bands (not present in this case) more reliably lay the groundwork for longer-term follow-through.)
Looking elsewhere, the Dow Jones Industrial Average is not breaking out.
Instead, the Dow has registered a modest May downturn, pulling in to the 50-day moving average, currently 33,250.
Delving deeper, the mid-May low (33,006) marks an inflection point.
Meanwhile, the S&P 500 has staged a modest May breakout.
The upturn has been punctuated by three straight closes atop the 4,170 resistance, the first consecutive closes higher since August.
Slightly more broadly, recall the May low (4,048) matched the April low (4,049), and remains an intermediate-term inflection point.
The bigger picture
As detailed above, the bigger-picture technicals remain bullish, on balance, though the backdrop is not one-size-fits-all.
Broadly speaking, large-cap technology has reasserted market leadership, sending the Nasdaq Composite and S&P 500 to multi-month highs. The Federal Reserve’s recently less-hawkish policy tone has contributed to the rotation.
Elsewhere, the Dow industrials continue to lag behind, pulling in to an extended test of the 50-day moving average.
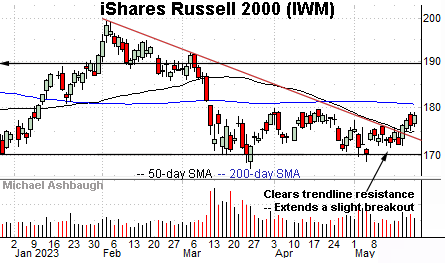
Moving to the small-caps, the iShares Russell 2000 ETF (IWM) has staged a May breakout, of sorts.
Specifically, the small-cap benchmark has cleared trendline resistance closely tracking the 50-day moving average.
On further strength, the 200-day moving average, currently 180.62, roughly matches a 10-week range top. The pending retest from underneath will likely add color.
Similarly, the SPDR S&P MidCap 400 ETF (MDY) has staged a modest trendline breakout.
Here again, the trendline closely tracks the 50-day moving average. (In fact, it almost precisely tracks the 50-day.)
More immediately, an extended test of the 200-day moving average (in blue) remains underway. On further strength, the 10-week range top (460.90) remains slightly more distant.
Combined, the small- and mid-cap benchmarks have cleared key trendlines though the breakouts get low marks for style. The pending upside follow-through, or lack thereof, may add color.
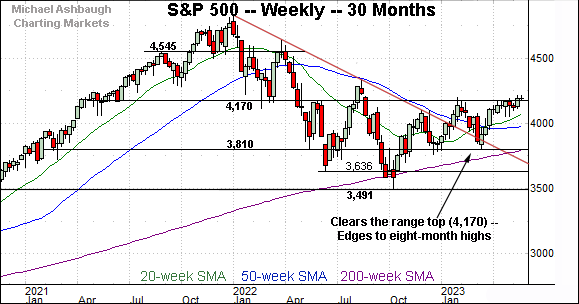
Returning to the S&P 500, this next chart is a weekly view spanning 30 months. Each bar on the chart represents one week.
As illustrated, the S&P has ventured atop major resistance (4,170) detailed repeatedly. (See the May 3, 2022 review — one year ago — and more recently, the March 7, 2023 review.)
In the process, the S&P has registered three straight closes atop resistance (4,170) for the first time since August 2022.
To be sure, the slight breakout barely registers on this weekly view. Nonetheless, a pulling-teeth breakout attempt is in play, a treacherous backdrop for market bears. Potentially aggressive upside acceleration is a prospect. (See the Nasdaq’s slight breakout, detailed last week, and subsequent acceleration.)
Tactically, an upside target projects from the prior range to the 4,545 area. (Start with 4,170 - 3,810 = 360. Then, add the result back to the breakout point: 4,170 + 360 = 4,530.)
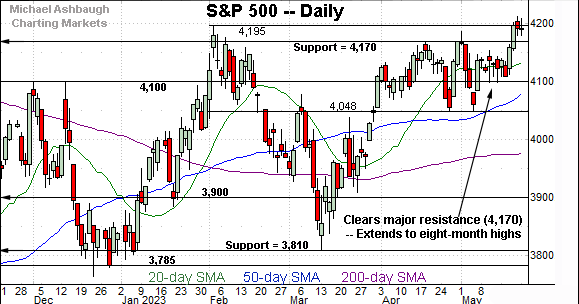
Narrowing to the S&P 500’s six-month view adds perspective.
As illustrated, the S&P has tagged eight-month highs. The prevailing upturn punctuates a seven-week range — a bullish continuation pattern — underpinned by well-defined support.
Tactically, the May low (4,048) closely matched the April low (4,049), and the index subsequently asserted a tighter range, underpinned by the 4,100 mark.
So based on today’s backdrop, the levels just detailed — the 4,050 and 4,100 areas — mark useful inflection points. An eventual violation would mark a material “lower low” raising a technical caution flag.
Barring such a move, the S&P 500’s bigger-picture bias remains bullish. On further strength, upside targets project initially to 4,290, and then the 4,545 area, as detailed on the weekly chart.
Also see May 9: Charting a stealth breakout attempt, Nasdaq challenges eight-month highs.
Editor’s Note: The next review will be published the week of June 5.

