Charting a stealth breakout attempt, S&P 500 hesitates at major resistance (4,170)
Focus: Projecting the Nasdaq's next upside target, Small- and mid-cap benchmarks underperform
Despite admittedly sluggish April price action, the major U.S. benchmarks are off to a constructive second-quarter start.
On a headline basis, the S&P 500 has thus far drawn muted selling pressure near major resistance (4,170), while the Nasdaq Composite remains within striking distance of equally significant overhead (12,270). The response to these areas, over the next several sessions, will likely contribute to the month-end technical tone.
Editor’s Note: As always, updates can be directly accessed at https://chartingmarkets.substack.com.
Before detailing the U.S. markets’ wider view, the S&P 500’s hourly chart highlights the past four weeks.
As illustrated, the S&P 500 has nailed major resistance (4,170), an area also detailed on the daily and weekly charts further down the page.
The week-to-date peak (4,169.5) has matched resistance, an inflection point going back two years.
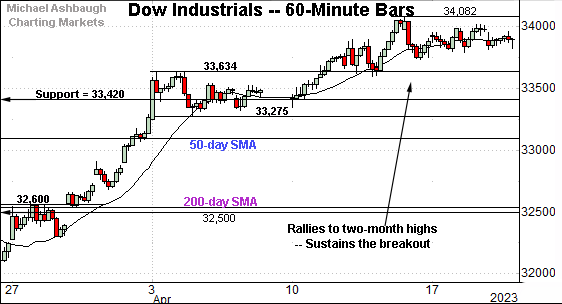
Meanwhile, the Dow Jones Industrial Average has sustained a break to two-month highs.
Here again, the initial pullback from the April peak has been flat.
Tactically, the breakout point (33,634) is followed by a firmer floor at 33,420, an area also detailed on the daily chart.
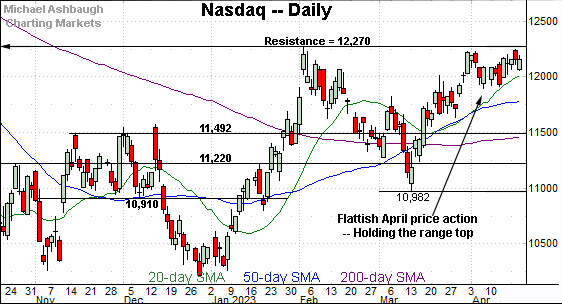
Against this backdrop, the Nasdaq Composite remains range-bound, though the index briefly tagged two-month highs earlier this week.
The index has since pulled in amid constructive April price action.
More broadly, recall each benchmark concluded March with a decisive rally atop its 50-day moving average, and has since sustained the break higher.
Widening the view to six months adds perspective.
On this wider view, the Nasdaq continues to press major resistance (12,270), an area defined by the Sept. peak (12,270) and Feb. peak (12,269).
Slightly more broadly, recall the developing cup-and-handle — defined by the March and April lows — a pattern hinged to the steep January rally. An intermediate-term target projects to the 12,560 area on follow-through. (This happens to match the Q1 2022 low of 12,555.)
Conversely, the April low (11,898) is followed by the 50-day moving average, currently 11,777. An eventual violation would likely wreck the breakout attempt.
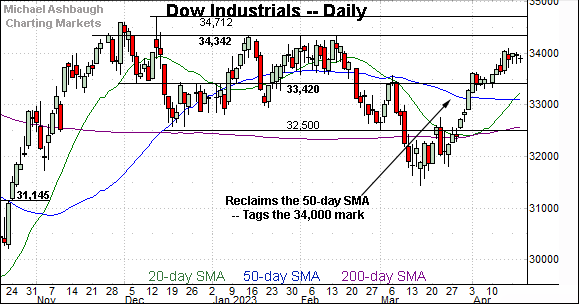
Looking elsewhere, the Dow Jones Industrial Average has tagged the 34,000 mark, an area that seems to be a near-term sticking point. (Also see the hourly chart.)
Tactically, the former breakdown point (33,420) is followed by the deeper 50-day moving average, currently 33,094. A sustained posture atop this area signals a bullish intermediate-term bias.
More broadly, the index is traversing a prolonged range hinged to the steep October-through-November rally. Constructive price action.
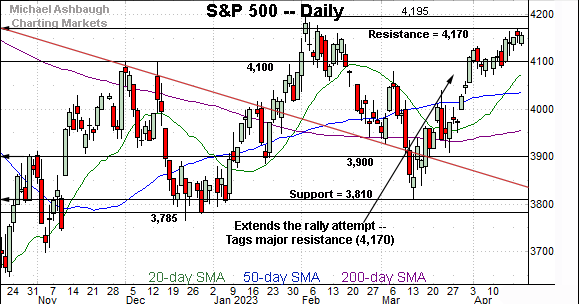
Meanwhile, the S&P 500 has nailed a headline inflection point.
The specific area matches major resistance (4,170), a level extending back two years, as detailed on the weekly chart in the next section.
The week-to-date peak (4,169.5) has matched resistance, and thus far modest selling pressure has surfaced.
The bigger picture
As detailed above, the major U.S. benchmarks are off to a constructive second-quarter (April) start.
Despite admittedly sluggish April price action, potentially consequential technical tests remain within view:
S&P 500 resistance at 4,170. The April peak (4,169.5) has matched resistance.
Nasdaq resistance at 12,270. The April peak (12,245) has registered nearby.
As always, the chances of a breakout improve to the extent an index holds relatively tightly to resistance. Both benchmarks have held tightly to resistance thus far.
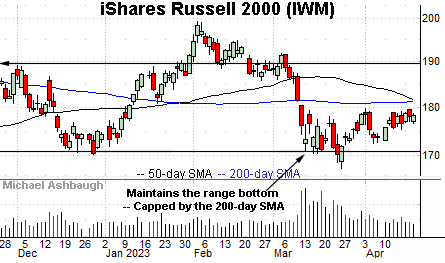
Moving to the small-caps, the iShares Russell 2000 ETF (IWM) remains range-bound.
The prevailing range is underpinned by major support, an area matching the Dec. low (170.34).
Against this backdrop, the April price action remains sluggish, fueled by decreased volume, and capped by the 200-day moving average. Eventual downside follow-through remains a prospect.
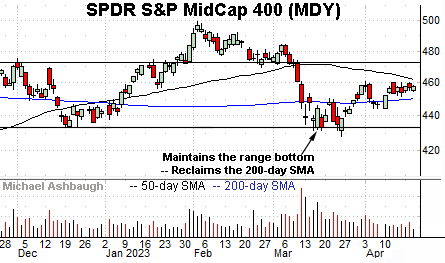
Similarly, the SPDR S&P MidCap 400 ETF (MDY) is traversing a familiar range.
Tactically, the 200-day moving average, currently 450.48, remains an inflection point, an area the MDY has not strayed far from over the prior six weeks.
More broadly, recall the developing head-and-shoulders top defined by the December, February and April peaks. (Also see the Russell 2000’s backdrop.)
Combined, the small- and mid-caps continue to underperform the big three U.S. benchmarks.
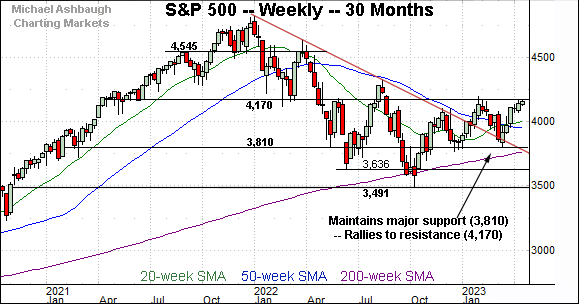
Returning to the S&P 500, this next chart is a weekly view spanning 30 months. Each bar on the chart represents one week.
As illustrated, the S&P has tagged major resistance (4,170) a familiar inflection point, detailed repeatedly. (See for instance, the May 3, 2022 review, and more recently, the March 15, 2023 review.)
The week-to-date peak (4,169.5) has matched resistance and thus far modest selling pressure has surfaced.
Conversely, recall the prevailing upturn originates from major support (3,810). The March low (3,809) registered nearby.
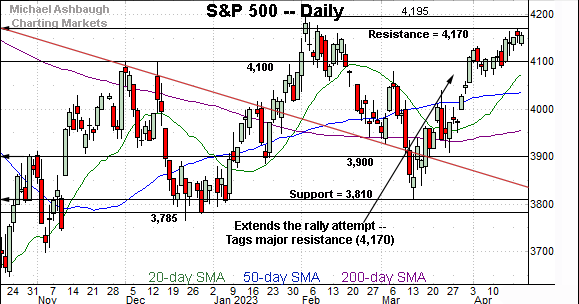
Narrowing to the S&P 500’s six-month view, familiar technical levels stand out.
Tactically, the prevailing rally originates from major support (3,810) — detailed on the weekly chart — and has subsequently tagged the 4,170 resistance.
From current levels, the 4,100 mark is followed by near-term support (4,070) and the deeper 50-day moving average, currently 4,034. A sustained posture atop the 50-day signals a bullish intermediate-term bias.
More broadly, the S&P 3,950 area remains a bull-bear fulcrum matching familiar inflection points:
The 200-day moving average, currently 3,956.
The mid-point of the former range (3,942).
As always, it’s not just what the markets do, it’s how they do it. But generally speaking, the S&P 500’s bigger-picture bias remains bullish-leaning barring a violation of the S&P 3,950 area.
Beyond technical levels, recall the worst six months seasonally — May through October — are less than two weeks away. No new setups today.
Editor’s Note: The next review will be published Wednesday, April 26.
Also see April 12: Charting a bull flag, S&P 500 sustains Q2 breakout.


