Charting successful technical tests, S&P 500 maintains 200-day average
Focus: Nasdaq whipsaws at major support, Dow industrials capped by 50-day average
Broadly speaking, the major U.S. benchmarks have thus far weathered consequential technical tests to start March.
On a headline basis, the S&P 500 has rallied from its 200-day moving average — an area matching an important trendline — though the initial upturn gets mixed marks for style. The pending upside follow-through, or lack thereof, will likely add color.
Editor’s Note: As always, updates can be directly accessed at https://chartingmarkets.substack.com.
Before detailing the U.S. markets’ wider view, the S&P 500’s hourly chart highlights the past four weeks.
As illustrated, the S&P has weathered a headline technical test.
Specifically, the index has knifed from its 200-day moving average, currently 3,940. As always, the 200-day is a widely-tracked longer-term trending indicator.
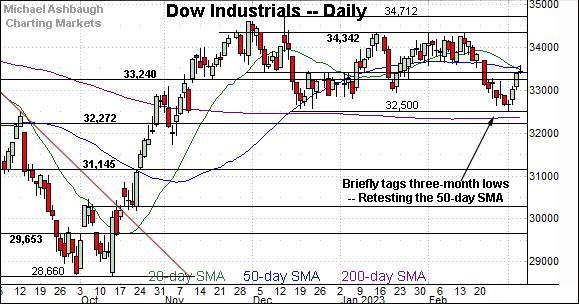
Meanwhile, the Dow Jones Industrial Average has rallied respectably from three-month lows.
Still, the prevailing upturn has been capped by the 50-day moving average, currently 33,536.
Recall the 50-day previously underpinned the Dow’s February range, as detailed on the daily chart.
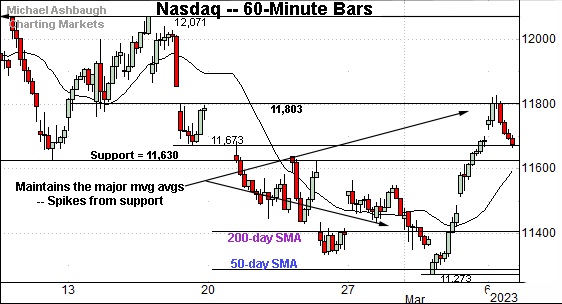
Against this backdrop, the Nasdaq Composite has also staged an early-March spike.
The upturn punctuates a jagged test of the 50- and 200-day moving averages, levels also detailed below.
Conversely, the rally has been capped by familiar gap resistance (11,803) an area detailed previously. (See the March 1 review.)
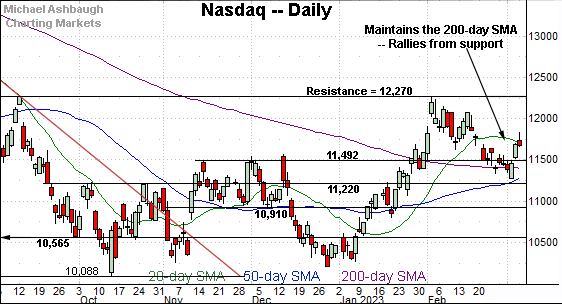
Widening the view to six months adds perspective.
On this wider view, the Nasdaq has survived a jagged test of its 200-day moving average, currently 11,403. Two recent closes registered narrowly lower, and the index has since staged an early-March spike. (Or reflexive bounce, depending on your view.)
Delving slightly deeper, the 50-day moving average, currently 11,290, is rising within view.
Tactically, as the 50- and 200-day moving averages converge, this area becomes a notable bull-bear fulcrum. (The crossover might be about five to six sessions off depending on the price action ahead.)
Looking elsewhere, the Dow Jones Industrial Average has reversed from three-month lows.
In the process, the index has preserved a four-month range, hinged to the steep October rally.
Against this backdrop, the index is retesting the 50-day moving average, currently 33,536, from underneath. Recall the 50-day formerly underpinned the early-February range
More broadly, the prevailing range bottom (32,500) is followed by the slightly deeper 200-day moving average, currently 32,380. Tactically, an eventual violation of the 32,380-to-32,500 area would raise a caution flag. (In this event, swift downside acceleration might be a “watch out.”)
So combined, the pending response to the Dow’s 50- and 200-day moving averages may contribute to the next material move.
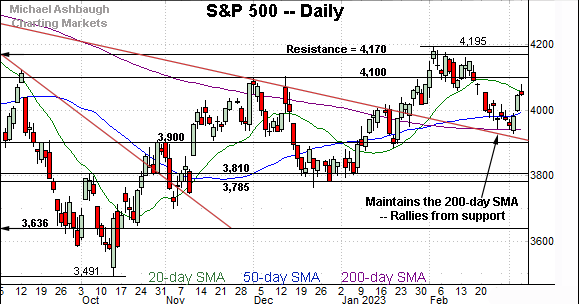
Meanwhile, the S&P 500 has survived a major technical test.
Specifically, the index has maintained its 200-day moving average, currently 3,940, an area closely followed by trendline support.
The initial spike from this area, at the turn of the month, gets mixed marks for style.
The bigger picture
As detailed above, the major U.S. benchmarks have weathered potentially consequential technical tests amid an early-March rally attempt.
On a headline basis, the S&P 500 has knifed from its 200-day moving average, while the Nasdaq Composite has registered a comparably jagged, but still successful, test of its 200-day moving average.
(Elsewhere, the Dow Jones Industrial Average has preserved a four-month range, though its 50-day moving average has thus far capped the early-March upturn.)
Moving to the small-caps, the iShares Russell 2000 ETF (IWM) is off to a sluggish March start, unlike the major U.S. benchmarks.
Against this backdrop, the small-cap benchmark continues to hug its former breakout point (189.90).
Tactically, the 50-day moving average, currently 186.05, is rising toward the 190 mark.
Similarly, the SPDR S&P MidCap 400 ETF (MDY) has registered a flattish two weeks even amid the major benchmarks’ recent whipsaw.
Slightly more broadly, the recent downturn has been underpinned by the breakout point (475.15).
Tactically, the 50-day moving average, currently 470.50, marked a December inflection point, and is rising toward support.
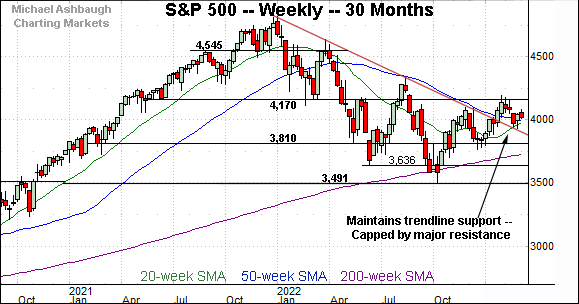
Returning to the S&P 500, this next chart is a weekly view spanning 30 months. Each bar on the chart represents one week.
As illustrated, the S&P 500 has weathered a retest of trendline support, a level hinged to the S&P’s all-time high.
The trendline test coincides with a successful test of the 200-day moving average, a level illustrated below. (This is an important technical test, and at least partly accounts for the S&P’s comparably sharp early-March spike vs. the small- and mid-caps benchmarks.)
Narrowing to the S&P 500’s six-month view adds perspective.
On this daily chart, the S&P has rallied respectably from its 200-day moving average. The 200-day (and the trendline) formerly capped the index at the August and December peaks.
More broadly, the S&P 500 has preserved a series of “higher highs” and “higher lows” also signaling an uptrend.
Still, the quality of the prevailing upturn, to start March, gets mixed marks for style. The index is rising from widely-tracked major support amid just lukewarm bullish momentum. Eventual upside follow-through atop the 4,100 area would strengthen the bull case.
Conversely, the 200-day moving average, currently 3,940, is followed by trendline support, a level descending toward the 3,900 mark.
As always, it’s not just what the markets do, it’s how they do it. But broadly speaking, the S&P 500’s bullish intermediate- to longer-term bias gets the benefit of the doubt barring a violation of the 3,900-to-3,940 area. The response to this week’s Federal Reserve policy language may add color.


