Charting a slow-motion breakout, Nasdaq grinds to eight-month high
Focus: Small- and mid-caps challenge key trendlines, Dow industrials retest 50-day average
Broadly speaking, the major U.S. stock benchmarks are acting well technically.
On a headline basis, the Nasdaq Composite has broken out — albeit in lukewarm form — rising to tag eight-month highs.
Meanwhile, the S&P 500 has asserted a May holding pattern, laying the groundwork for a potential breakout. The charts below add color:
Editor’s Note: As always, updates can be directly accessed at https://chartingmarkets.substack.com.
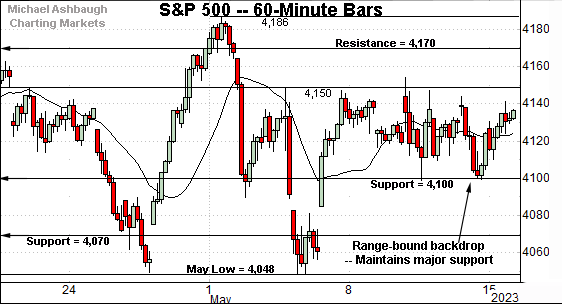
Before detailing the U.S. markets’ wider view, the S&P 500’s hourly chart highlights the past four weeks.
As illustrated, the S&P 500 has asserted a holding pattern, traversing a tight range underpinned by major support (4,100). (Also see the daily chart.)
Delving deeper, recall the May low (4,048) closely matched the April low (4,049) to punctuate a successful retest.
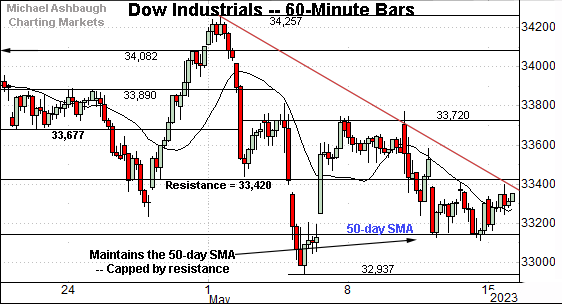
Meanwhile, the Dow Jones Industrial Average has pulled in toward its range bottom.
Amid the downturn, the index has thus far maintained its 50-day moving average, currently 33,145.
Tactically, the May trendline is closely followed by major resistance (33,420) an area also detailed on the daily chart.
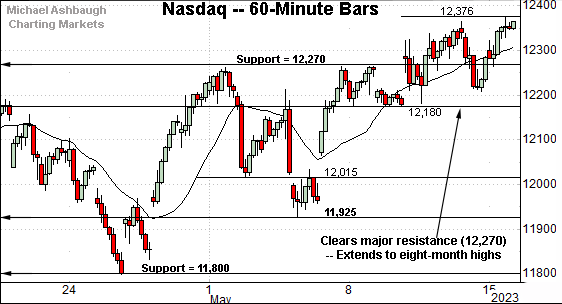
Against this backdrop, the Nasdaq Composite continues to outperform.
As illustrated, the index has cleared major resistance (12,270), rising to tag eight-month highs.
Slightly more broadly, the prevailing upturn originates from the May low (11,925) matching familiar support (11,924) detailed previously. (See the May 3 review.)
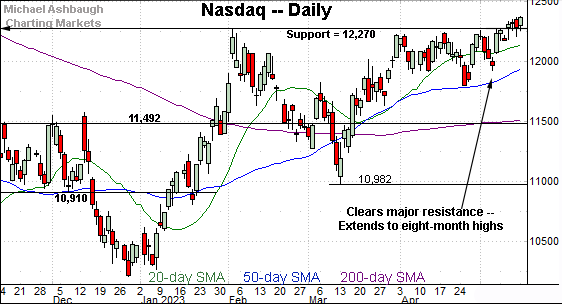
Widening the view to six months adds perspective.
On this wider view, the Nasdaq has ventured atop major resistance (12,270), an area defined by the Sept. peak (12,270) and Feb. peak (12,269).
But to be sure, the May breakout gets mixed marks for style (at best) as measured by volume, breadth and price action. Sustainability and follow-through remain question marks.
Reservations aside, an intermediate-term target continues to project to the 12,560 area, territory closely matching the Q1 2022 low of 12,555. (See the April 20 review.)
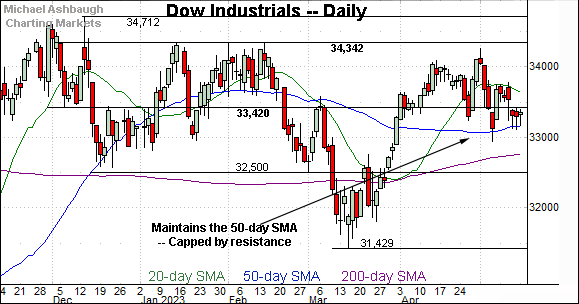
Looking elsewhere, the Dow Jones Industrial Average has extended a May downturn.
Amid the pullback, the index has maintained its 50-day moving average, preserving a range-bound backdrop. Recall the 50-day (in blue) marked a February inflection point.
Conversely, consider that major resistance (33,420) has capped the very recent price action. (Also see the hourly chart.)
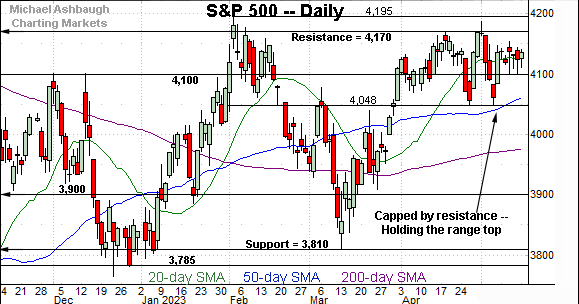
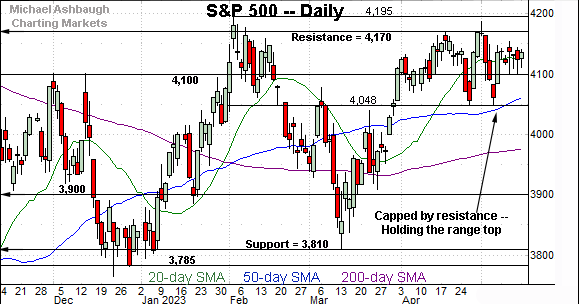
Meanwhile, the S&P 500 is traversing a well-defined seven-week range.
Tactically, the May low (4,048) has closely matched the April low (4,049), and remains an intermediate-term inflection point.
Conversely, the S&P remains capped by major resistance (4,170), a level extending back two years.
The bigger picture
As detailed above, the major U.S. benchmarks are acting well technically.
On a headline basis, the Nasdaq Composite continues to diverge, rising to tag eight-month highs.
Meanwhile, the S&P 500 is hugging its range top, laying the groundwork for a potential breakout.
Against this backdrop, each big three U.S. benchmark has recently maintained its 50-day moving average near the April or May lows. Constructive price action.
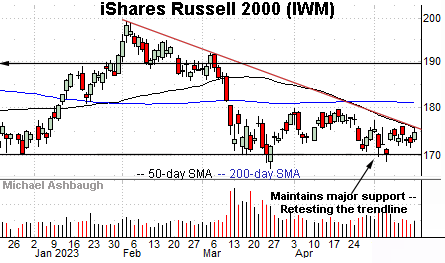
Moving to the small-caps, the iShares Russell 2000 ETF (IWM) maintained major support (170.30) to start May.
Still, the subsequent rally attempt has been sluggish, fueled by decreased volume.
Tactically, trendline resistance closely tracks the 50-day moving average, currently 175.30. Follow-through atop the trendline would strengthen the bull case.
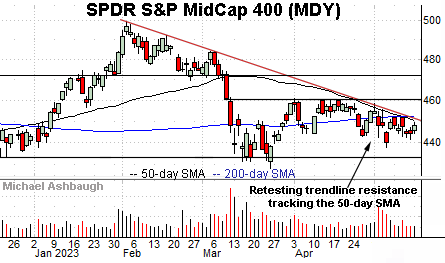
Similarly, the SPDR S&P MidCap 400 ETF (MDY) is off to a sluggish May start.
But here again, the MDY is pressing trendline resistance closely tracking the 50-day moving average, currently 449.50.
Also recall the 200-day moving average (452.05) rests in the vicinity, and has marked an inflection point.
Combined, the small- and mid-cap benchmarks are pressing key trendlines. Eventual upside follow-through would strengthen the broad-market bull case.
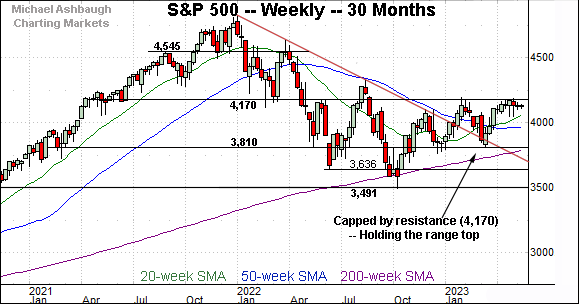
Returning to the S&P 500, this next chart is a weekly view spanning 30 months. Each bar on the chart represents one week.
As illustrated, the S&P remains capped by major resistance (4,170) detailed repeatedly. (See the May 3, 2022 review — one year ago — and more recently, the March 7, 2023 review.)
The April peak (4,170.06) matched resistance amid a retest that remains in play. As always, the chances of a breakout improve to the extent an index holds relatively tightly to resistance.
Conversely, the prevailing upturn originates from major support (3,810). Recall the March low (3,809) registered nearby.
Narrowing to the S&P 500’s six-month view adds perspective.
Recall that loosely speaking, the range detailed on the weekly chart — spanning from 3,810 to 4,170 — has defined the 2023 price action. Just two closes have registered narrowly outside this range. (The Jan. 5 close (3,808) and the Feb. 2 close (4,179).)
Also recall this range precedes 2023. See the Dec. 20, 2022 review.
Against this backdrop, the S&P is acting well near the range top. The May low (4,048) closely matched the April low (4,049), and the index has since asserted a higher plateau underpinned by the 4,100 mark.
Separately, the S&P’s orderly seven-week range — spanning from about 4,050 to 4,170 — is a bullish continuation pattern, hinged to the steep rally from major support (3,810).
Tactically, the 50-day moving average, currently 4,060, is closely followed by well-defined support (4,048). A sustained posture atop the 50-day signals a bullish intermediate-term bias.
More broadly, the S&P 3,940-to-3,975 area remains a more important bull-bear fulcrum, matching two inflection points:
The 200-day moving average, currently 3,975.
The mid-point of the late-2022 range (3,942).
Broadly speaking, the S&P 500’s bigger-picture bias remains bullish barring a violation of the S&P 3,975 area. The response to any U.S. debt-ceiling progress, or lack thereof, may add color.
Editor’s Note: The next review will be published Tuesday, May 23.


