Charting a stealth breakout attempt, Nasdaq challenges eight-month highs
Focus: S&P 500 asserts well-defined range, Dow industrials maintain 50-day average
Technically speaking, the major U.S. benchmarks are off to a constructive May start.
On a headline basis, the S&P 500 has maintained its range, surviving a retest of the 4,050 area.
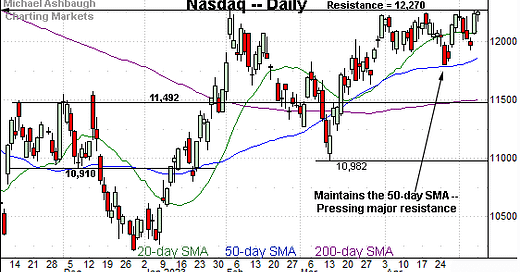
Meanwhile, the Nasdaq Composite has strengthened versus the other benchmarks, rising to challenge major resistance (12,270).
Combined, the May selling pressure near resistance remains muted, improving the chances of eventual breakouts. The response to this week’s consumer inflation data will likely add color.
Editor’s Note: As always, updates can be directly accessed at https://chartingmarkets.substack.com.
Before detailing the U.S. markets’ wider view, the S&P 500’s hourly chart highlights the past four weeks.
As illustrated, the S&P 500 has weathered a turn-of-the-month whipsaw.
Amid the volatility, the May low (4,048) has closely matched the April low (4,049) to punctuate a successful retest. Constructive price action.
Slighly more broadly, the S&P remains capped by major resistance (4,170), an area also detailed on the daily chart.
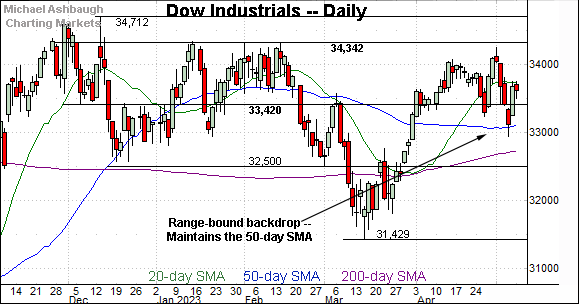
Similarly, the Dow Jones Industrial Average is digesting a turn-of-the-month whipsaw.
Tactically, the index remains range-bound, and has weathered a jagged test of its 50-day moving average, currently 33,116. (Also see the daily chart.)
Against this backdrop, the Nasdaq Composite continues to strengthen versus the other benchmarks.
Tactically, the May low (11,925) has matched familiar support (11,924) detailed previously. (See the May 3 review.)
More immediately, the prevailing spike to the range top places major resistance (12,270) under siege. The May peak (12,265) has registered within five points.
Widening the view to six months adds perspective.
On this wider view, the Nasdaq is challenging major resistance (12,270), an area defined by the Sept. peak (12,270) and Feb. peak (12,269).
The May peak (12,265) has registered within five points amid a retest that remains in play.
Slightly more broadly, recall the prevailing upturn punctuates a successful test of the 50-day moving average. Market bulls will point to a developing cup-and-handle — defined by the March and April lows — and hinged to the steep January spike. Bullish price action near eight-month highs.
Looking elsewhere, the Dow Jones Industrial Average is not pressing its range top.
Still, the index has recently maintained its 50-day moving average, preserving a range-bound backdrop. Recall the 50-day marked a February inflection point.
Meanwhile, the S&P 500 has established a well-defined six-week range.
Tactically, the May low (4,048) has closely matched the April low (4,049), an area underpinning the prevailing range. The 50-day moving average, currently 4,047, also matches support.
Conversely, the S&P remains capped by major resistance (4,170), a level extending back two years.
The bigger picture
As detailed above, the major U.S. benchmarks are off to a constructive May start.
On a headline basis, the S&P 500 has rattled its range, an area currently spanning from about 4,050 to 4,170.
Meanwhile, the Nasdaq Composite has strengthened versus the other benchmarks, rising to challenge major resistance (12,270).
Against this backdrop, the May selling pressure near resistance remains muted, improving the chances of eventual upside follow-through.
Moving to the small-caps, the iShares Russell 2000 ETF (IWM) has effectively nailed major support (170.30), an area detailed repeatedly.
Last week’s closing low (170.40) registered nearby.
Still, the recent strong-volume downturn has been punctuated by a lighter-volume rally attempt. Eventual downside follow-through remains a risk.
Similarly, the SPDR S&P MidCap 400 ETF (MDY) is off to a sluggish May start. Here again, the prevailing upturn has been fueled by decreased volume.
Tactically, the 200-day moving average (452.10) and 50-day moving average (452.76) rest just overhead. Recall the 50-day average marked a late-December hurdle.
Slightly more broadly, notice the pending death cross, or bearish 50-day/200-day moving average crossover. Though frequently a lagging indicator, the crossover signals the intermediate-term downtrend has overtaken the longer-term trend.
Combined, the small- and mid-cap benchmarks’ backdrop remains bearish based on today’s backdrop.
Returning to the S&P 500, this next chart is a weekly view spanning 30 months. Each bar on the chart represents one week.
As illustrated, the S&P remains capped by major resistance (4,170) detailed repeatedly. (See the May 3, 2022 review — one year ago — and more recently, the March 15, 2023 review.)
The April peak (4,170.06) matched resistance amid an extended retest.
Conversely, recall the prevailing upturn originates from major support (3,810). The March low (3,809) registered nearby.
Narrowing to the S&P 500’s six-month view adds perspective.
Recall that loosely speaking, the range detailed on the weekly chart — spanning from 3,810 to 4,170 — has defined the 2023 price action. Just two closes have registered narrowly outside this range. (The Jan. 5 close (3,808) and the Feb. 2 close (4,179).)
Also recall this range precedes 2023. See the Dec. 20, 2022 review.
Against this backdrop, the S&P continues to act well near the range top. The May low (4,048) has closely matched the April low (4,049), and both tests have been punctuated by respectable rally attempts.
Separately, the S&P’s orderly six-week range — spanning from about 4,050 to 4,170 — is a bullish continuation pattern, hinged to the steep rally from major support (3,810).
Tactically, the 50-day moving average, currently 4,047, closely matches well-defined support (4,048). A sustained posture atop the 50-day signals a bullish intermediate-term bias.
More broadly, the S&P 3,940-to-3,970 area remains a more important bull-bear fulcrum, matching two inflection points:
The 200-day moving average, currently 3,972.
The mid-point of the late-2022 range (3,942).
Generally speaking, the S&P 500’s bigger-picture bias remains bullish barring a violation of the S&P 3,970 area. The response to this week’s consumer inflation data will likely add color. No new setups today.
Editor’s Note: The next review will be published Tuesday, May 16.


