Bearish momentum persists, S&P 500 challenges 200-day average
Focus: Transports signal bearish trend shift, small- and mid-caps challenge key support
Technically speaking, the major U.S. benchmarks are off to a less-than-stellar April start, pulling in to key technical tests.
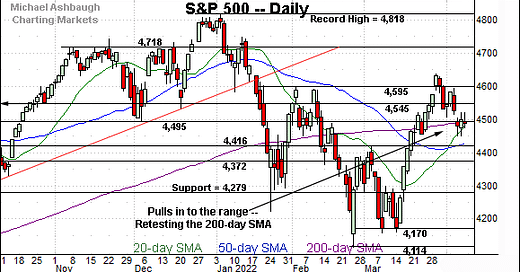
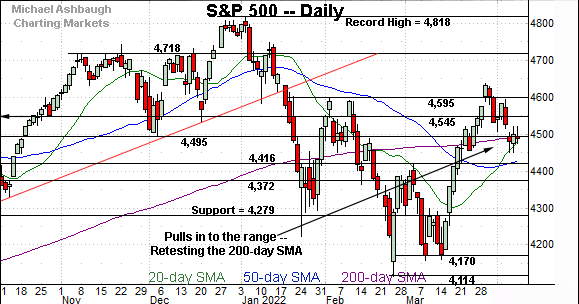
On a headline basis, the S&P 500 continues to challenge its 200-day moving average, currently 4,493, a level closely matching major support (4,495). This area marks a widely-tracked bull-bear inflection point, and a sustained violation would raise a caution flag.
Editor’s Note: As always, updates can be directly accessed at https://chartingmarkets.substack.com.
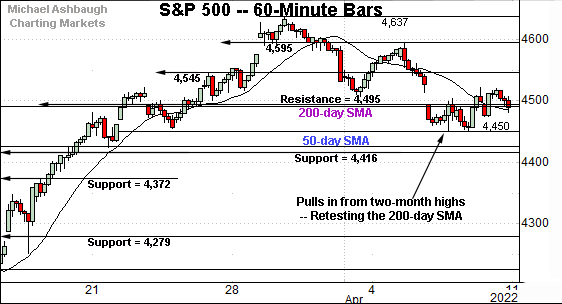
Before detailing the U.S. markets’ wider view, the S&P 500’s hourly chart highlights the past four weeks.
As illustrated, the S&P has pulled in to a headline technical test.
Specifically, the index is retesting major support (4,495) and the 200-day moving average, currently 4,493.
Last week’s close (4,488) registered slightly under the 200-day and the S&P has extended its downturn early Monday.
Meanwhile, the Dow Jones Industrial Average has pulled in from major resistance (35,366) an area detailed on the daily chart.
Tactically, the 50-day moving average, currently 34,377, is followed by the April low (34,190). The latter marks a three-week range bottom.
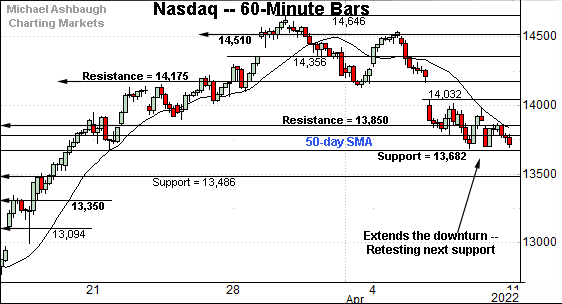
Against this backdrop, the Nasdaq Composite has pulled in to next support (13,682), detailed previously.
Consecutive session lows — Thursday (13,689) and Friday (13,693) — registered nearby. The index has ventured firmly under support early Monday.
Slightly more broadly, the index has ventured under the mid-March breakout point (13,850) and the 50-day moving average. Both levels are also illustrated below.
Widening the view to six months adds perspective.
On this wider view, the Nasdaq has extended its April downturn, violating two key technical levels:
The mid-March breakout point (13,850).
The 50-day moving average, currently 13,792.
As detailed repeatedly, this area marks a bull-bear inflection point. The weekly close (13,710) under support signals a bearish-leaning intermediate-term bias.
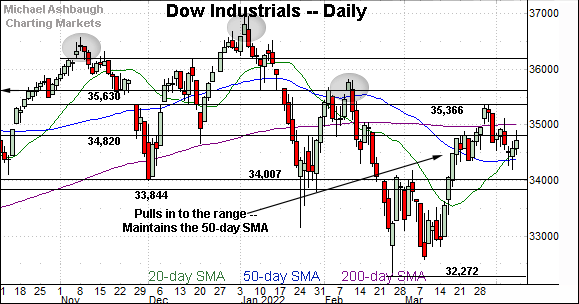
Looking elsewhere, the Dow Jones Industrial Average is traversing its former range.
Recall the prevailing pullback originates from major resistance (35,366). The March peak (35,372) registered nearby.
Conversely, the Dow has thus far maintained its 50-day moving average, currently 34,377.
Delving deeper, the April low (34,190) is followed by a firmer floor around the 34,000 mark. (Also see the hourly chart.)
Meanwhile, the S&P 500 has reached a headline technical test.
Recall major support spans from 4,493 to 4,495, levels matching the 200-day moving average and the December low.
Last week’s close (4,488) registered slightly lower amid an extended retest.
The bigger picture
As detailed above, the major U.S. benchmarks are off to a less-than-stellar April start.
On a headline basis, the Nasdaq Composite has violated major support (13,850), signaling a bearish-leaning intermediate-term bias.
Meanwhile, the S&P 500 has ventured back under its 200-day moving average amid a potentially consequential test that remains in play.
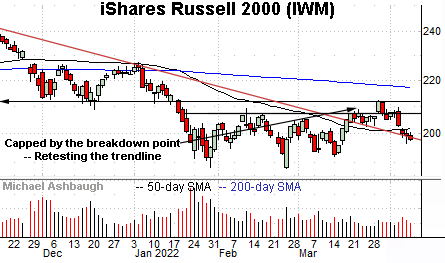
Moving to the small-caps, the iShares Russell 2000 ETF has also extended its downturn.
The prevailing pullback places it under the 50-day moving average, currently 201.76, and the slightly deeper trendline.
On further weakness, the March low (191.88) marks an inflection point.
Meanwhile, the SPDR S&P MidCap 400 ETF is challenging its range bottom, circa 477.00.
Last week’s close (477.03) matched support. Sustained follow-through under this area would strengthen the bear case.
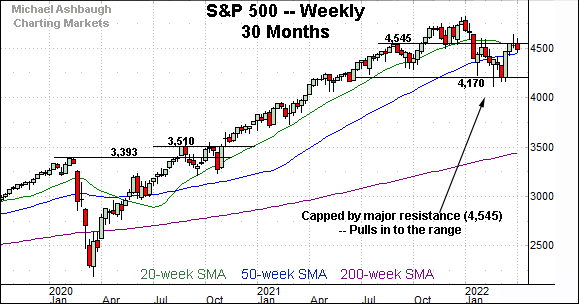
Returning to the S&P 500, this next chart is a weekly view, spanning 30 months. Each bar on the chart represents one week.
As illustrated, the S&P continues to traverse a lower plateau.
Recall consecutive weekly closes — at 4,545 and 4,543 — effectively matched major resistance (4,545), a level defining the range top. (This area has been detailed previously. See for instance, the Feb. 18 review and Mar. 28 review.)
The index subsequently pulled in to last week’s retest of the 50-week moving average, currently 4,450. Market bears might point to a developing head-and-shoulders top.
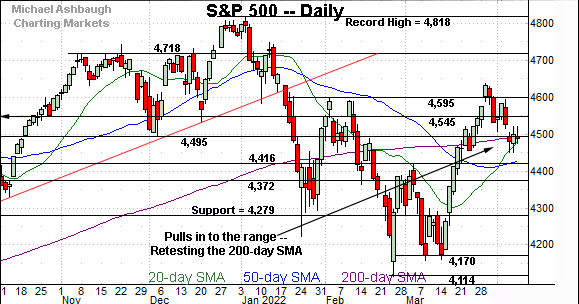
Returning to the six-month view, the S&P 500 has reached a headline technical test.
To reiterate, major support spans from 4,493 to 4,495, levels matching the 200-day moving average and the December low.
Last week’s close (4,488) registered slightly lower to punctuate a three-session retest. Monday’s early downside follow-through raises the flag to a potenial violation.
Tactically, the 4,495 area marks a widely-tracked inflection point. A sustained violation would signal a bearish-leaning intermediate- to longer-term bias.
No new setups today, though note that the Dow Transports have staged an aggressive April downdraft, signaling a bearish trend shift.

