Charting a primary trend shift, S&P 500 (decisively) violates 200-day average
Focus: Gold's breakout, Gold miners clear key trendline, Nasdaq's death cross, Dow industrials' head-and-shoulders top, DJIA, GLD, GDX, SBLK
Technically speaking, the U.S. benchmarks’ already bearish bigger-picture backdrop continues to deteriorate.
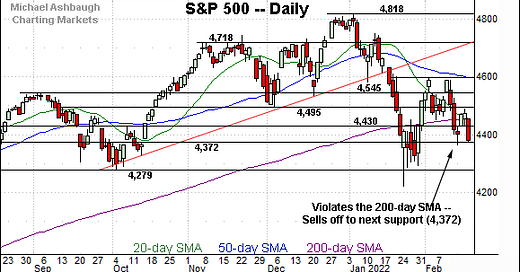
On a headline basis, the S&P 500 has knifed decisively under its 200-day moving average — as well as major support (4,430), detailed Feb. 11 — to punctuate an ultimately failed multi-day retest. The aggressive 2%+ violation signals a primary trend shift, pending repairs.
Editor’s Note: As always, updates can be directly accessed at https://chartingmarkets.substack.com. (Experimenting with a new layout on the Charting Markets main page.)
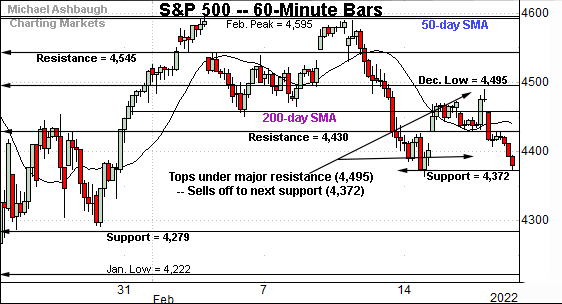
Before detailing the U.S. markets’ wider view, the S&P 500’s hourly chart highlights the past four weeks.
As illustrated, the S&P has topped this week slightly under major resistance (4,495), an area also detailed on the daily chart.
The subsequent pullback places the index back under the 200-day moving average, as well as the 4,430 mark. This area broadly defines a key bull-bear inflection point, detailed repeatedly.
(On a granular note, Thursday’s session high (4,456) registered within one point of the 200-day moving average, currently 4,457. The subsequent mid-session high (4,429) matched the 4,430 resistance. Bearish price action.)
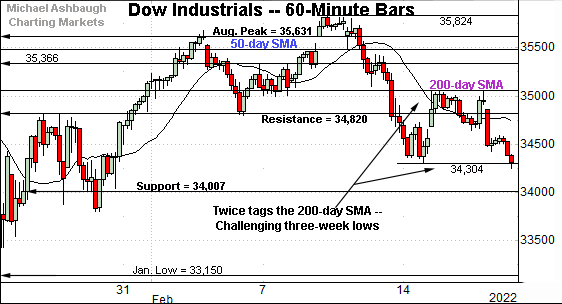
Meanwhile, the Dow Jones Industrial Average has failed a headline technical test.
The specific area matches the 200-day moving average, currently 35,050.
Against this backdrop, Tuesday’s session high (35,048) and Wednesday’s session high (35,042) have effectively matched the 200-day moving average to punctuate failed retests from underneath.
Put differently, the week-to-date peak (35,048) has matched the 200-day moving average, and the index has subsequently pulled in to challenge three-week lows. Bearish price action.
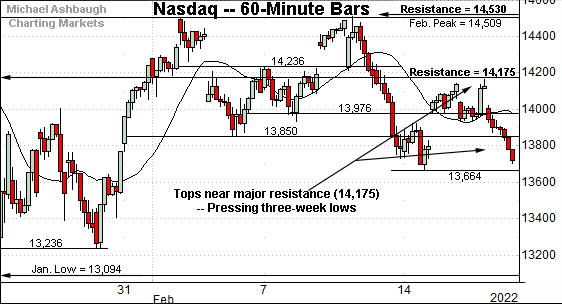
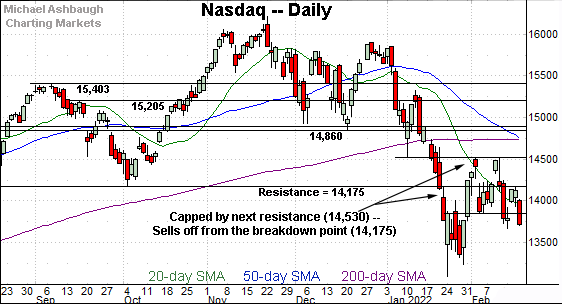
Against this backdrop, the Nasdaq Composite has also failed a key technical test.
Here again, the week-to-date peak (14,164) has registered near major resistance (14,175), an area better illustrated below.
The prevailing downturn places three-week lows within view.
Combined, each big three U.S. benchmark has drawn selling pressure this week near well-defined resistance.
Widening the view to six months adds perspective.
On this wider view, the Nasdaq has extended a pullback from the February peak. Recall the prevailing downturn punctuates consecutive failed tests of major resistance (14,530).
More immediately, the index has stalled this week near its former breakdown point (14,175). The week-to-date high (14,164) registered nearby, and selling pressure has surfaced.
Separately, the Nasdaq’s death cross — or bearish 50-day/200-day moving average crossover — has indeed signaled Friday. (See Wednesday’s review for added detail.)
Tactically, the Nasdaq’s bigger-picture backdrop remains bearish pending follow-through atop resistance (14,530) and the major moving averages.
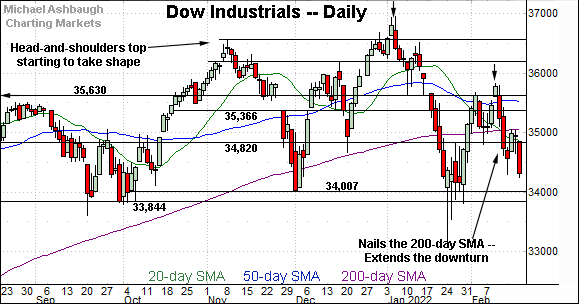
Looking elsewhere, the Dow Jones Industrial Average has extended a pullback from the February peak amid increasingly bearish price action.
Tactically, the index has stalled this week almost precisely at the 200-day moving average, currently 35,050. The week-to-date high (35,048) effectively matched the 200-day, and pronounced selling pressure has surfaced.
More broadly, recall the developing head-and-shoulders top defined by the November, January and February peaks. An eventual violation of the 34,000 area would resolve the bearish pattern, opening the path to potentially swift downside follow-through.
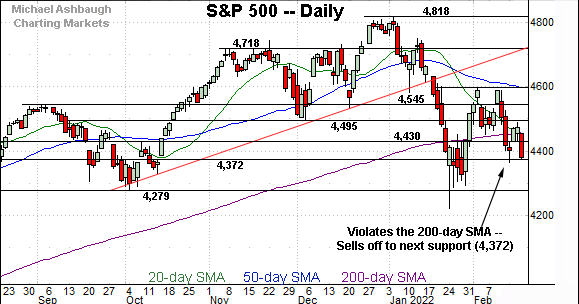
Similarly, the S&P 500 has failed a key technical test.
In its case, the index has stalled this week near its former breakdown point (4,495). The week-to-date peak (4,490) registered nearby, and here again, pronounced selling pressure has surfaced.
Conversely, the S&P at least initially maintained next support (4,372), an area detailed repeatedly.
Thursday’s session low (4,373) closely matched support, though the retest remains underway.
The bigger picture
As detailed above, an already bearish bigger-picture backdrop continues to deteriorate.
On a headline basis, each big three benchmark has failed a key technical test this week — see Nasdaq 14,175, the Dow industrials’ 200-day moving average, and S&P 4,495.
Moreover, respectable selling pressure has subseuqently surfaced, placing three-week lows under siege. Bearish price action.
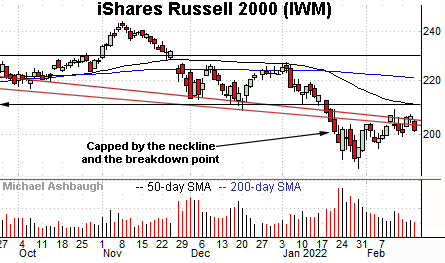
Moving to the small-caps, the iShares Russell 2000 ETF continues to lag behind the major U.S. benchmarks.
As illustrated, the small-cap benchmark remains capped by the neckline of its head-and-shoulders top. More distant overhead matches the breakdown point, an area broadly spanning from 208.75 to 211.10.
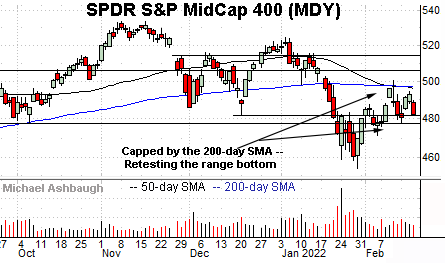
Meanwhile, the SPDR S&P MidCap 400 ETF remains comparably stronger, sustaining a reversal to its former range.
Still, the MDY remains capped by its 50- and 200-day moving averages, widely-tracked intermediate- and longer-term trending indicators respectively.
Tactically, familiar support matches the former breakdown point (477.50) and the December low (481.48), detailed previously. (See for instance, the Feb. 7 review.)
Thursday’s session low (481.47) matched support amid a retest that remains underway. (Also recall Tuesday’s session low (477.59) matched the deeper support point.)
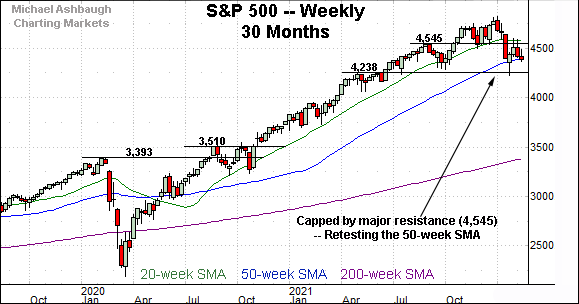
Returning to the S&P 500, this next chart is a weekly view, spanning 30 months. Each bar on the chart represents one week.
As illustrated, the S&P has asserted a lower plateau following an aggressive downdraft from its record high (4,818), established Jan. 4, 2022.
From top to bottom, the downturn spanned as much as 470 points, or 9.8%, on a closing basis, nearly reaching the 10% correction milestone.
Against this backdrop, the prevailing range has been capped by the 4,545 resistance on a weekly closing basis. (See the Feb. 11 review for added detail regarding this area.)
More immediately, the index is challenging its 50-week moving average, currently 4,393. Friday’s early session high (4,394) has registered nearby.
So the S&P 500 looks likely Friday to register its first weekly close materially under the 50-week moving average since May 2020.
Returning to the S&P 500’s daily chart, its six-month backdrop is increasingly bearish.
At the risk of getting too granular, an important bull-bear inflection point — detailed last week (Feb. 11) — broadly spans from 4,430 to the 200-day moving average, currently 4,457.
This area has repeatedly been in play this week.
To start, Tuesday’s session low (4,429) and Wednesday’s session low (4,429) matched the 4,430 support to punctuate shaky, but initially successful, retests.
Then, Thursday’s session high (4,456) effectively matched the 200-day moving average to cap an aggressive 95-point, 2.1%, single-day downdraft.
(Also recall Thursday’s mid-session high (4,429), around 11:45 ET, matched the 4,430 resistance to punctuate a failed test from underneath.)
As always, it’s not just what the markets do, it’s how they do it.
In this case, the S&P 500’s price action has been technical — observing key levels — and punctuated by Thursday’s aggressive 2.1% single-day violation of the 200-day moving average.
More broadly, the S&P 500 staged an aggressive January downdraft — followed by a comparably flat February rally attempt — and is now frequently finding selling pressure near well-defined resistance.
Combined, the S&P 500’s prevailing backdrop supports a bearish longer-term bias, pending repairs. An eventual rally atop the 200-day moving average, and the 4,495 resistance, would be cause to reassess.
Watch List
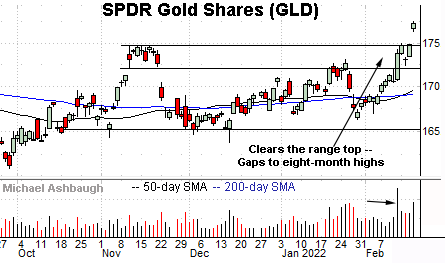
Drilling down futher, the SPDR Gold Shares ETF — profiled Wednesday — has broken out, rising amid heightened geopolitical tensions.
The prevailing upturn places the shares at eight-month highs.
More broadly, the breakout punctuates a massive double bottom illustrated on the one-year chart. (The pattern is defined by the August and December 2021 lows.)
Tactically, the top of the gap (176.40) is followed by the firmer breakout point (174.85). A sustained posture higher lays the groundwork for potentially material upside follow-through.
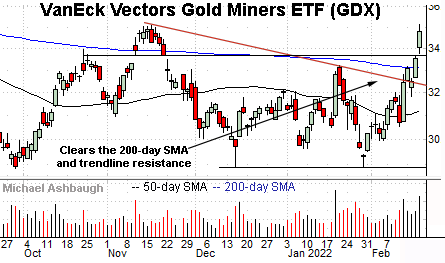
Moving to U.S. sectors, the VanEck Vectors Gold Miners ETF has come to life technically.
As illustrated, the group has knifed atop trendline resistance — and the 200-day moving average — rising to briefly tag six-month highs. Recent strength has been fueled by a sustained volume increase.
More broadly, the group is vying to break from a double bottom — defined by the September 2021 and January 2022 lows — illustrated on the one-year chart.
Tactically, the prevailing rally attempt is intact barring a violation of the breakout point (33.50) and the slightly deeper 200-day moving average.
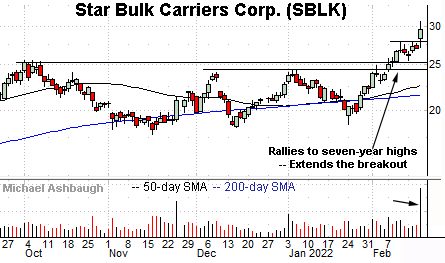
Finally, Star Bulk Carriers Corp. — profiled Wednesday — has taken flight.
In fact, the shares notched the Nasdaq’s third-largest daily percentage gain Thursday, rising 9.8% even as the Nasdaq dropped 2.9% on the session.
The company’s unexpectedly strong quarterly results fueled the strong-volume spike.
Though near-term extended, and due to consolidate, the shares remain well positioned on the five-year chart. Tactically, the breakout point (27.90) pivots to support.

