S&P 500's massive March rally attempt meets major resistance (4,545)
Focus: Nasdaq Composite also hesitates at major resistance (14,175) amid still muted selling pressure
Technically speaking, the major U.S. benchmarks have thus far sustained an aggressive spike from the March low.
But against this backdrop, the rally attempt has reached two headline overhead inflection points — S&P 4,545 and Nasdaq 14,175.
Last week’s high (S&P 4,546) and last week’s close (Nasdaq 14,169) closely matched resistance. The pending retests from underneath will likely add color.
Editor’s Note: As always, updates can be directly accessed at https://chartingmarkets.substack.com.
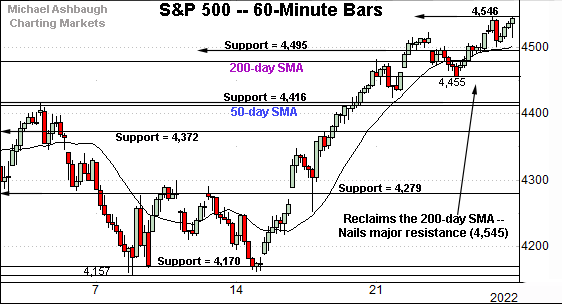
Before detailing the U.S. markets’ wider view, the S&P 500’s hourly chart highlights the past four weeks.
As illustrated, the S&P has slightly extended its March breakout.
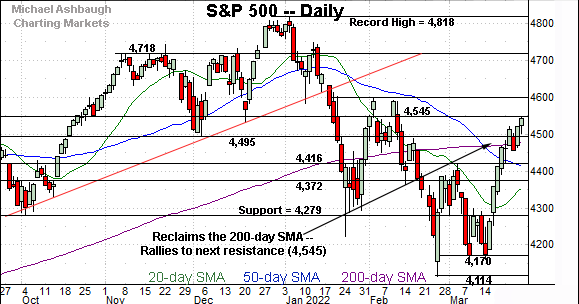
The prevailing upturn has thus far been capped by major resistance (4,545) an area better illustrated on the daily chart.
Conversely, the 4,495 area pivots to support and is closely followed by the 200-day moving average, currently 4,478.
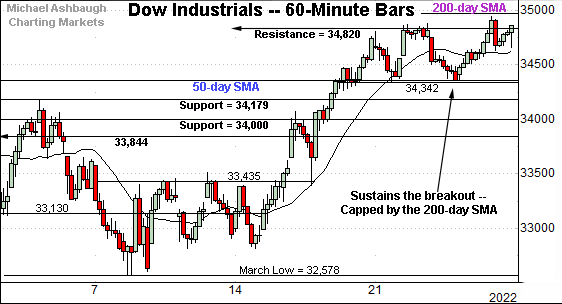
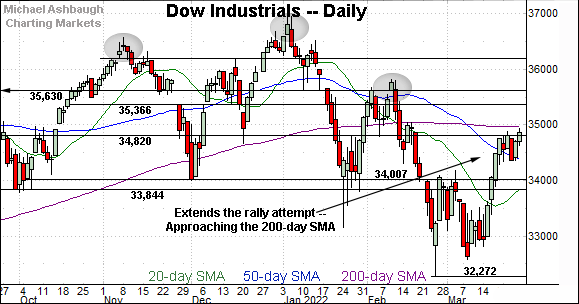
Similarly, the Dow Jones Industrial Average has narrowly extended its break to one-month highs.
Tactically, familiar inflection points — detailed previously — remain in play:
The 34,820 area, also detailed on the daily chart.
The more distant 200-day moving average, currently 34,978.
Last week’s close (34,861) registered nearby, though the Dow has subsequently pulled in to start this week.
Delving deeper, the 50-day moving average, currently 34,352, closely matches near-term support (34,342).
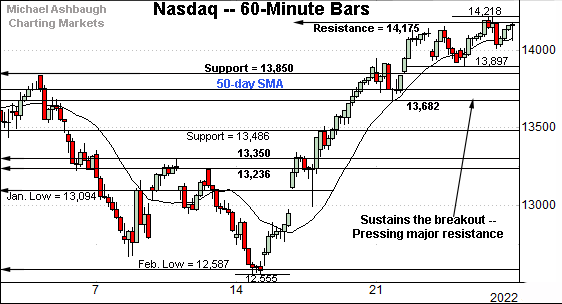
Against this backdrop, the Nasdaq Composite is also digesting a recent breakout.
Tactically, an extended test of major resistance (14,175) remains underway.
Last week’s close (14,169) registered slightly under resistance.
Conversely, the Nasdaq’s breakout point — the 13,837-to-13,850 area — pivots to notable support.
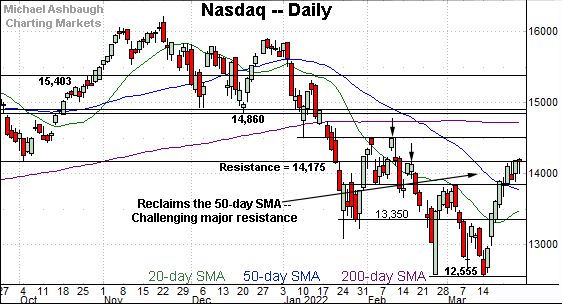
Widening the view to six months adds perspective.
On this wider view, the Nasdaq has extended its rally attempt, placing distance atop the 50-day moving average.
The breakout also marks a “higher high” versus the early-March peak, consistent with a trend shift. The Nasdaq’s intermediate-term bias remains bullish-leaning barring a violation of the 13,850 area.
More immediately, the rally attempt has thus far stalled at major resistance (14,175) — detailed repeatedly — an area matching the late-2021 range bottom.
To reiterate, last week’s close (14,169) registered slightly under resistance.
On further strength, more distant overhead matches the Feb. peak (14,509).
Looking elsewhere, the Dow Jones Industrial Average has slightly extended its rally attempt.
Last week’s close (34,861) registered slightly atop major resistance (34,820), though the index has pulled in to start this week.
The slightly more distant 200-day moving average, currently 34,978, remains within view.
Conversely, the 50-day moving average, currently 34,350, is followed by the Dow’s former breakdown point (34,007). Broadly speaking, the prevailing recovery attempt is intact barring a violation of this area.
Meanwhile, the S&P 500 remains the strongest major benchmark.
This is the only index to clear its 200-day moving average, currently 4,478.
More immediately, recent follow-through places major resistance (4,545) under siege. Last week’s high (4,546) effectively matched resistance.
The bigger picture
As detailed above, the major U.S. benchmarks have extended an aggressive spike from the March low.
In the process, the prevailing rally attempt has reached two headline overhead inflection points — Nasdaq 14,175, and S&P 4,545. (See the daily charts.)
The pending retests — the response to each area — should be a useful bull-bear gauge.
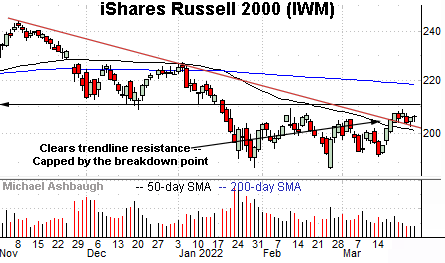
Moving to the small-caps, the iShares Russell 2000 ETF has sustained a modest trendline breakout.
Tactically, trendline support roughly tracks the 50-day moving average, currently 201.12.
Conversely, overhead inflection points match the Feb. peak (209.05) and the firmer breakdown point (211.10).
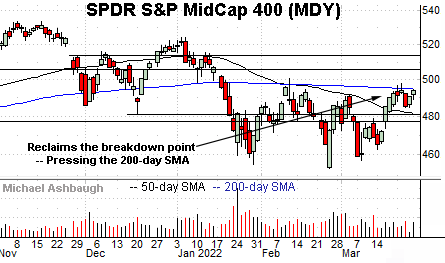
Meanwhile, the SPDR S&P MidCap 400 ETF remains comparably stronger than the Russell 2000.
Tactically, an extended test of the 200-day moving average, currently 495.18, remains underway.
Eventual follow-through atop the 200-day would punctuate a material “higher high” strengthening the bull case. (The 200-day moving average capped the February rally attempt.)
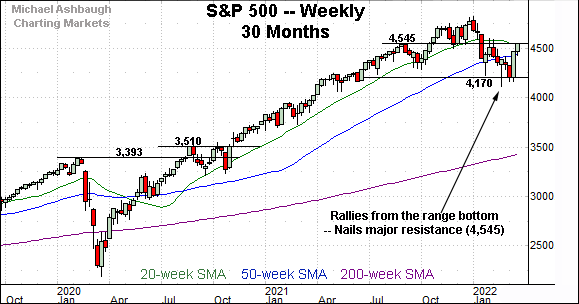
Returning to the S&P 500, this next chart is a weekly view, spanning 30 months. Each bar on the chart represents one week.
As illustrated, the S&P is traversing a lower plateau following the early-2022 downturn from its record high (4,818), established Jan. 4, 2022.
From top to bottom, the downturn spanned as much as 626 points, or 13.0%, on a closing basis.
More immediately, the prevailing upturn places major resistance (4,545) under siege, an area detailed previously. (See for instance, the Feb. 18 review.)
Last week’s high (4,546) matched resistance. An extended retest remains underway.
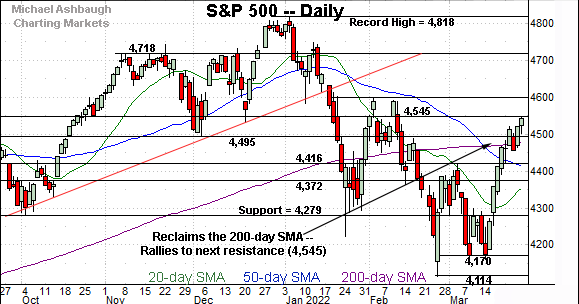
Returning to the S&P 500’s six-month view adds perspective.
As illustrated, the S&P’s nearly straightline spike from the March low has been punctuated by a shallow pullback, and modest upside follow-through. Bullish price action.
Still, the prevailing rally has thus far paused near major resistance (4,545) also detailed on the 30-month chart. The aggressiveness of the selling pressure in this area, or lack thereof, will likely add color.
Tactically, the 4,478-to-4,495 area pivots to support, the former matching the 200-day moving average.
Delving deeper, the March breakout point (4,416) marks a notable floor.
As always, it’s not just what the markets do, it’s how they do it.
But generally speaking, the S&P 500’s recovery attempt is intact — and its backdrop supports a bullish intermediate-term bias — barring a violation of the breakout point (4,416).


