Charting a garden-variety pullback, S&P 500 asserts holding pattern
Focus: Consecutive weekly closes match major resistance (4,545) amid stalemate
Technically speaking, the major U.S. benchmarks are vying to stabilize in the wake of a massive rally from the March lows.
Against this backdrop, each index has weathered a comparably flattish pullback from recent highs, amid selling pressure that has thus far inflicted limited damge.
Editor’s Note: As always, updates can be directly accessed at https://chartingmarkets.substack.com.
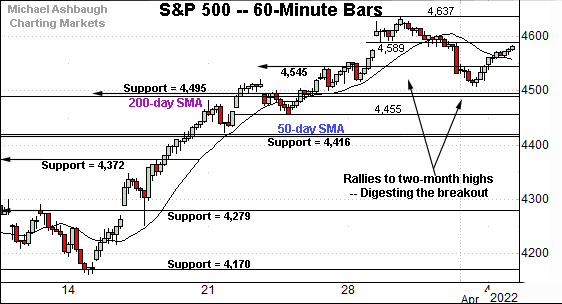
Before detailing the U.S. markets’ wider view, the S&P 500’s hourly chart highlights the past four weeks.
As illustrated, the S&P is consolidating a recent rally to two-month highs. The prevailing pullback has been relatively shallow.
Tactically, major support (4,495) is closely followed by the 200-day moving average, currently 4,489.
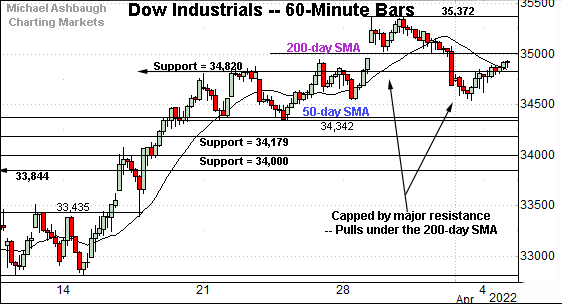
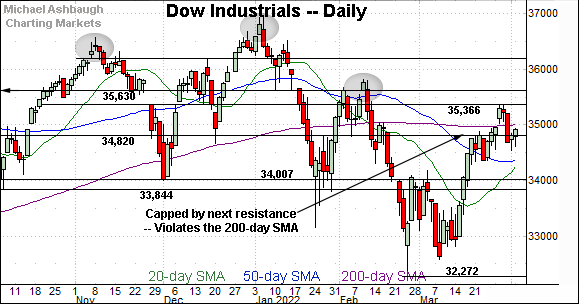
Meanwhile, the Dow Jones Industrial Average is digesting a rally to six-week highs.
The prevailing downturn originates from major resistance (35,366) an area detailed on the daily chart. Consecutive session highs registered within six points.
Separately, the modest pullback places the Dow back under its 200-day moving average, currently 35,010.
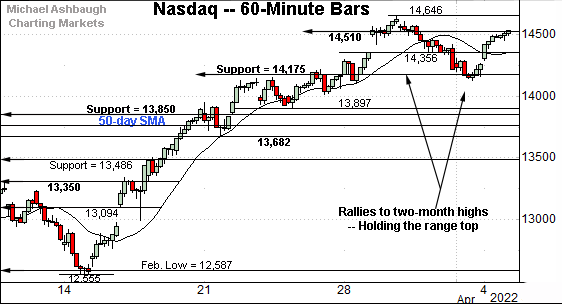
Against this backdrop, the Nasdaq Composite is consolidating a rally to two-month highs.
The recent pullback has been comparably shallow, and underpinned by major suport (14,175) on a closing basis. (Also see the daily chart below.)
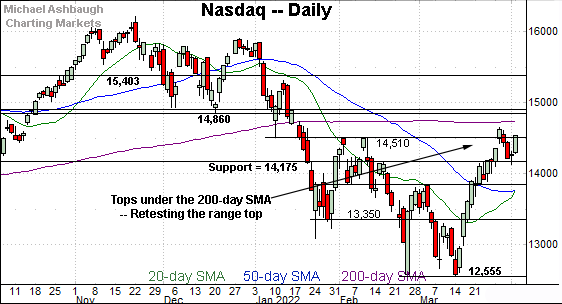
Widening the view to six months adds perspective.
On this wider view, the Nasdaq is vying to stablize in the wake of a massive rally from the March low.
An extended test of the former range top (14,510) remains in play.
Conversely, major support (14,175) is followed by the mid-March breakout point (13,850). The 50-day moving average is rising modestly toward support.
Tactically, the Nasdaq’s intermediate-term bias remains bullish barring a violation of these areas.
Looking elsewhere, the Dow Jones Industrial Average has pulled in from major resistance (35,366).
To reiterate, consecutive session highs registered within six points. (See the session highs last Tuesday (35,372) and Wednesday (35,361).)
More immediately, the prevailing pullback places the index back under its 200-day moving average, currrently 35,010.
Separately, the 34,820 inflection point remains in play. Last week’s close (34,818) registered nearby.
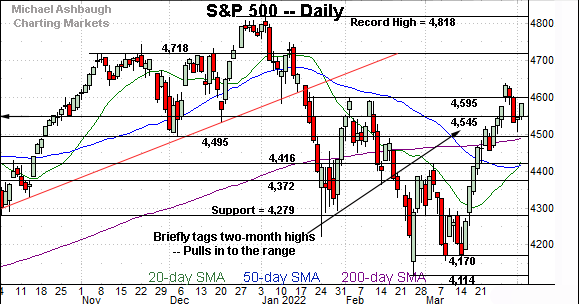
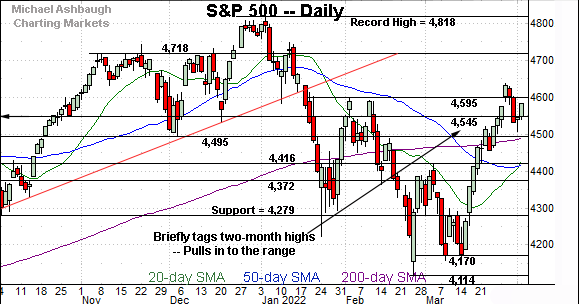
Meanwhile, the S&P 500 has pulled in to its range from two-month highs.
Tactically, major support spans from 4,489 to 4,495, the former matching the 200-day moving average.
Separately, the 4,545 inflection point remains in play. Here again, last week’s close (4,545) matched the inflection point. (The prior week’s close (4,543) also registered nearby.)
The bigger picture
As detailed above, the major U.S. benchmarks are vying to stabilize in the wake of a massive March rally.
The prevailing pullback has been comparably flat — at least so far — inflicting limited damage. (See, for instance, the S&P 500 and Nasdaq Composite hourly charts.)
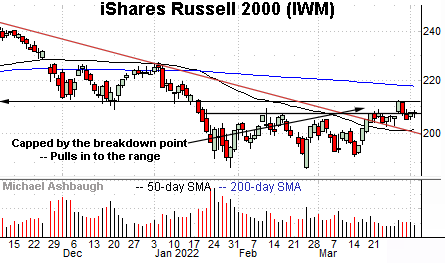
Moving to the small-caps, the iShares Russell 2000 ETF continues to largely tread water.
Tactically, the breakdown point has capped its upturn. Familiar resistance holds in the 211.10-to-212.25 area.
Conversely, trendline support closely matches the 50-day moving average, currently 201.54. The prevailing rally attempt is intact barring a violation.
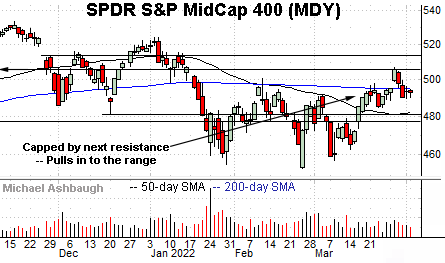
Similarly, the SPDR S&P MidCap 400 ETF has pulled in modestly from two-month highs.
An extended test of the 200-day moving average, currently 495.35, remains underway. Recall the 200-day has effectively defined a two-month range top.
More broadly, the small- and mid-cap benchmarks concluded March with false breakouts. The subsequent selling pressure, and downside follow-through, has thus far been limited.
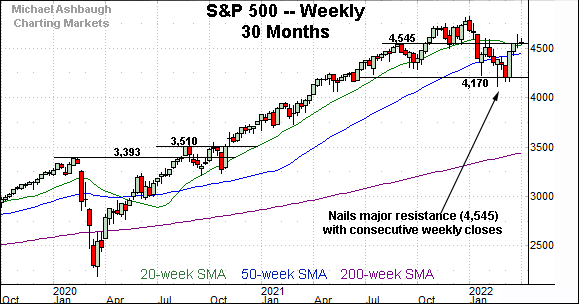
Returning to the S&P 500, this next chart is a weekly view, spanning 30 months. Each bar on the chart represents one week.
As illustrated, the S&P is traversing a lower plateau.
Against this backdrop, the index has balked at major resistance (4,545) — detailed repeatedly — a level defining the range top. (See for instance, the Feb. 18 review and Mar. 28 review.)
To reiterate, last week’s close (4,545) matched resistance, and the prior week’s close (4,543) also registered nearby.
Put differently, the prevailing retest has thus far concluded with a bull-bear stalemate. The pending selling pressure, or lack thereof, will likely add color.
Returning to the six-month view, the S&P 500 is consolidating a massive March rally.
The nearly straightline spike from the March low has been punctuated by a comparably flat pullback, signaling the recovery attempt is intact.
Against this backdrop, an important floor spans from the 200-day moving average, currently 4,489, to major support (4,495) matching the December low.
As always, it’s not just what the markets do, it’s how they do it.
But generally speaking, the S&P 500’s recovery attempt gets the benefit of the doubt barring a violation of the 4,489-to-4,495 area. No new setups today.


