Charting a shaky technical tilt, S&P 500 ventures under 200-day average
Focus: 10-year yield continues to take flight, Insurance sector digests breakout, TNX, KIE, CTRA, NUE, MDT
Technically speaking, the major U.S. benchmarks have extended an April downturn, pressured amid a series of hawkish Federal Reserve policy remarks.
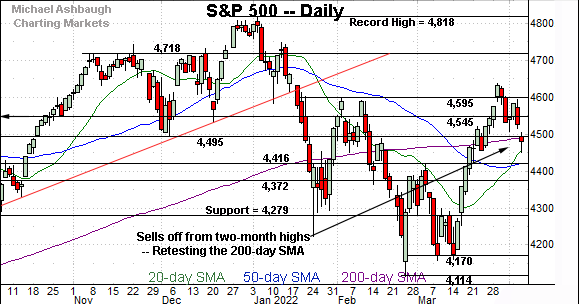
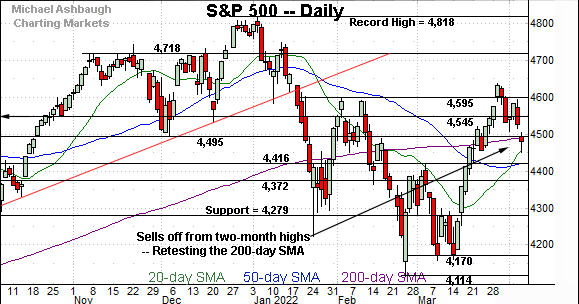
Against this backdrop, the S&P 500 has ventured under its 200-day moving average, an area closely matching major support (4,495). A potentially consequential technical test remains underway.
Editor’s Note: As always, updates can be directly accessed at https://chartingmarkets.substack.com.
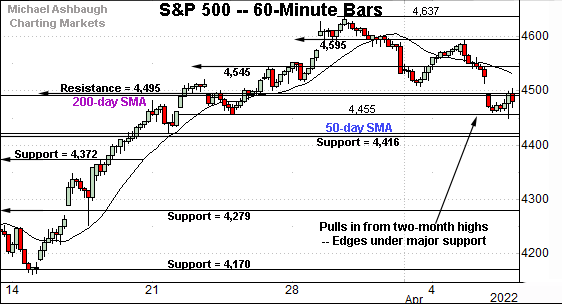
Before detailing the U.S. markets’ wider view, the S&P 500’s hourly chart highlights the past four weeks.
As illustrated, the S&P has ventured slightly under a notable floor.
The specific area matches major support (4,495) and the 200-day moving average, currently 4,491.
Thursday’s early session high (4,491) has matched the inflection point.
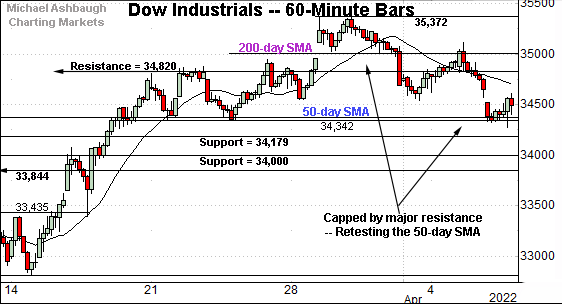
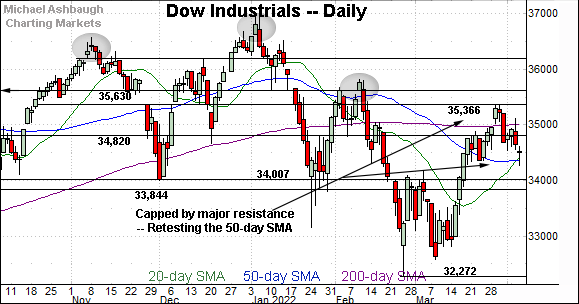
Meanwhile, the Dow Jones Industrial Average has extended a pullback from major resistance (35,366) an area detailed on the daily chart.
The downturn places its 50-day moving average, currently 34,364, under siege. The 50-day closely matches a three-week range bottom.
Slightly more broadly, the Dow’s pullback has been punctuated by a failed test of the 200-day moving average from underneath.
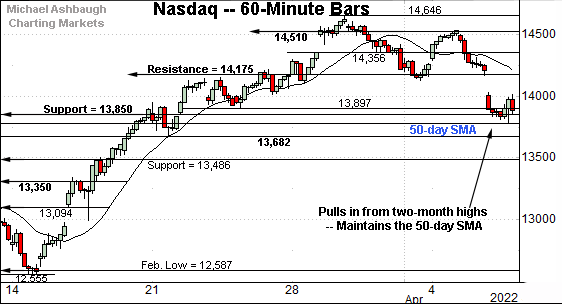
Against this backdrop, the Nasdaq Composite has also pulled in to notable support.
The specific area matches the mid-March breakout point (13,850) and the 50-day moving average.
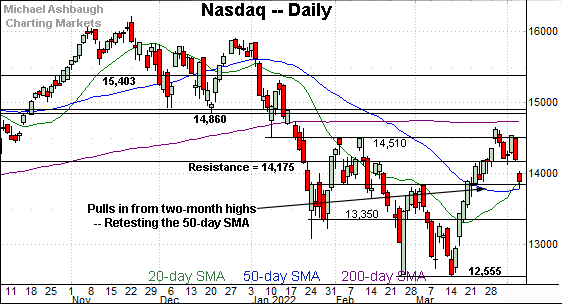
Both levels are perhaps better illustrated on the daily chart below.
Widening the view to six months adds perspective.
On this wider view, the Nasdaq has extended a pullback from two-month highs. The downturn places two areas under siege:
The mid-March breakout point (13,850).
The 50-day moving average, currently 13,788.
Against this backdrop, Wednesday’s session low (13,788) matched the 50-day moving average.
As detailed repeatedly, this area marks a bull-bear inflection point. Sustained follow-through lower would signal a bearish intermediate-term bias.
Looking elsewhere, the Dow Jones Industrial Average has extended a pullback from major resistance (35,366).
Recall consecutive session highs registered within six points of resistance.
More immediately, the prevailing downturn places the 50-day moving average, currently 34,364, under siege.
On further weakness, near-term support (34,180) is followed by a firmer floor around the 34,000 mark. (Also see the hourly chart.)
Similarly, the S&P 500 has extended its April downturn.
Tactically, major support spans from 4,491 to 4,495, levels matching the 200-day moving average and the December low.
Thursday’s early session high (4,491) matched the inflection point, and selling pressure has surfaced.
The bigger picture
As detailed above, the major U.S. benchmarks have extended an April downturn, pressured amid a series of hawkish Federal Reserve policy remarks.
Against this backdrop, each big three benchmark has pulled in to notable support. Potentially consequential technical tests are currently underway. (See the hourly charts.)
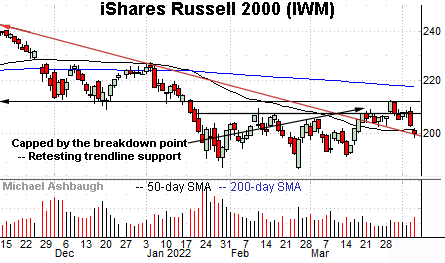
Moving to the small-caps, the iShares Russell 2000 ETF has reached a key technical test.
Specifically, the shares are challenging the 50-day moving average, currently 201.56, an area closely followed by trendline support.
The prevailing downturn has been fueled by a volume uptick, and punctuates a failed test of the breakdown point. Shaky price action.
As detailed repeatedly, a violation of trendline support would wreck the small-cap benchmark’s recovery attempt.
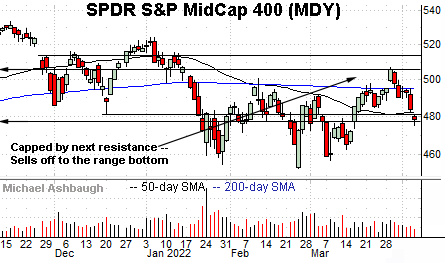
Meanwhile, the SPDR S&P MidCap 400 ETF has extended its downturn, placing distance back under the 200-day moving average.
The pullback places its former range bottom, circa 477.00, under siege. Sustained follow-through under this area would strengthen the bear case.
Returning to the S&P 500, its downturn from the March peak has accelerated, placing a headline technical test in play.
To reiterate, major support spans from 4,491 to 4,495, levels matching the 200-day moving average and the December low. (See Tuesday’s review.)
Against this backdrop, Thursday’s early session high (4,491) has matched the 200-day moving average to punctuate a failed retest from underneath. Shaky price action.
Tactically, this area marks a widely-tracked, and in this case, relatively well-defined inflection point.
A sustained violation would signal market bulls are not dictating technical tone, suggesting the S&P 500’s recovery attempt may have run its course.
The prevailing retest — across potentially the next several sessions — should be a useful bull-bear gauge. The weekly close will also likely add color.
Watch List
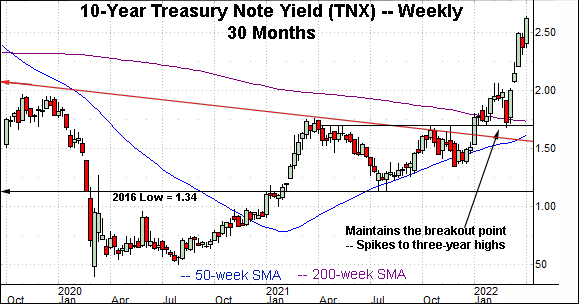
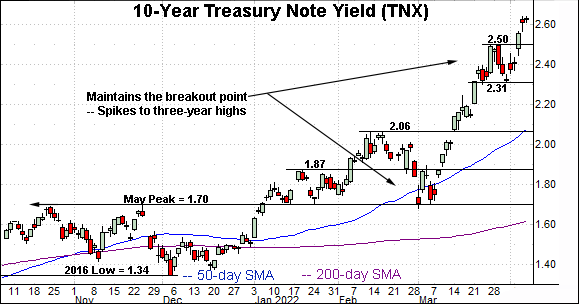
Drilling down further, the 10-year Treasury note yield (TNX) continues to take flight.
In the process, the yield has knifed to three-year highs, its highest levels since March 2019.
More broadly, the yield started 2022 with a sharp trendline breakout — (see the 30-month chart) — and has since followed through aggressively over just the past four weeks.
From bottom to top, the prevailing leg higher has spanned 96 basis points, across just 25 sessions, amid the yield’s fastest rate of change since the 1990’s.
(The March 4 low registered at 1.70%. The yield has tagged 2.66% on April 7, nearly one full percentage point higher.)
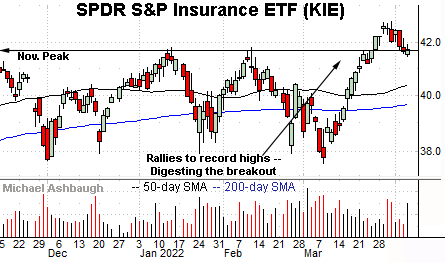
Moving to U.S. sectors, the SPDR S&P Insurance ETF (KIE) is acting well technically. (Yield = 1.8%.)
Late last month, the group knifed to all-time highs, rising from a triple bottom defined by the November, January and March lows.
The subsequent pullback has been underpinned by the breakout point (41.70), a level detailed previously. (See the March 30 review.)
Wednesday’s close (41.70) precisely matched support to place the group 2.6% under the March peak.
Delving deeper, a near-term floor (40.95) is followed by the ascending 50-day moving average, currently 40.40. A sustained posture higher signals a bullish-leaning bias.
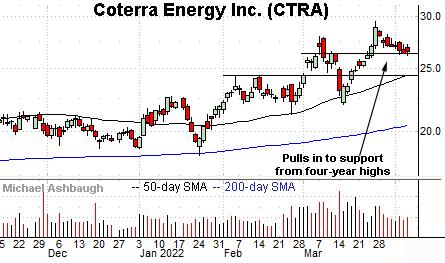
Moving to specific names, Coterra Energy, Inc. (CTRA) is a well positioned large-cap oil and gas name. (Yield = 1.9%.)
Technically, the shares have formed a flag-like pattern hinged to the steep mid-March rally.
The prevailing pullback has been fueled by decreased volume, placing the shares 11.3% under the March peak.
Tactically, the prevailing range bottom (26.20) marks support. A sustained posture higher signals a firmly-bullish bias.
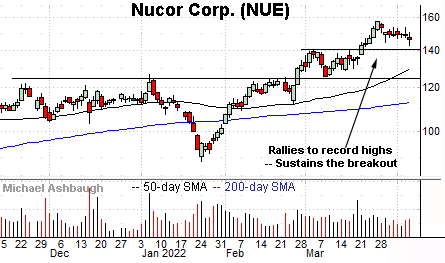
Nucor Corp. (NUE) is a well positioned large-cap steel producer.
Late last month, the shares knifed to all-time highs, clearing resistance matching the early-March peak.
The ensuing pullback has been comparably flat, placing the shares 7.6% under the March peak. Tactically, a well-defined floor matches the breakout point (140.20).
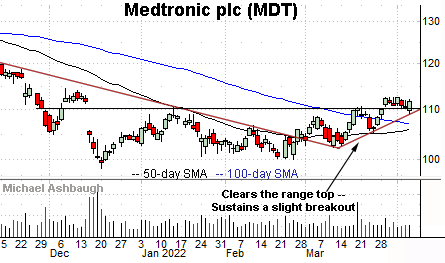
Finally, Medtronic (MDT) is a large-cap medical device maker showing signs of life. (Yield = 2.2%.)
As illustrated, the shares have sustained a modest break to three-month highs. The prevailing flag-like pattern — the tight one-week range — signals still muted selling pressure, laying the groundwork for potential upside follow-through.
Tactically, trendline support closely matches the breakout point (110.20). The prevailing rally attempt is intact barring a violation.


