Bearish momentum accelerates, S&P 500 violates major support amid 9-to-1 down day
Focus: Dow Transports and Amazon balk at 200-day average, Apple reaches key technical test, TRAN, XLF, XLU, AAPL, AMZN
Technically speaking, the major U.S. benchmarks have extended an August downturn, pulling in amid relatively aggressive late-month selling pressure.
In the process, each index has violated major support, extending to challenge the widely-tracked 50-day moving average. The charts below add color:
Editor’s Note: As always, updates can be directly accessed at https://chartingmarkets.substack.com.
Before detailing the U.S. markets’ wider view, the S&P 500’s hourly chart highlights the past four weeks.
As illustrated, the S&P is digesting a downdraft to one-month lows.
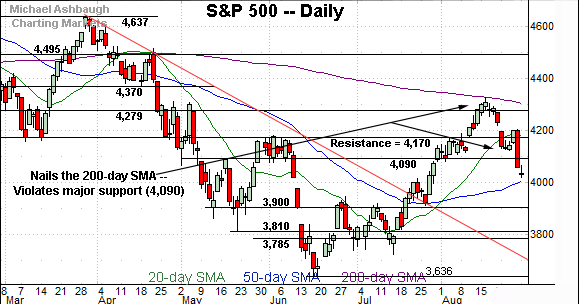
The prevailing downturn originates from the 200-day moving average, a level better illustrated on the daily chart.
Tactically, the 4,090 area pivots to resistance.
Similarly, the Dow Jones Industrial Average is digesting a plunge to one-month lows.
Tactically, the subsequent rally attempt has been distinctly flat, and capped by major resistance (32,272), an area also detailed on the daily chart.
Against this backdrop, the Nasdaq Composite has also reached a less-charted patch.
Tactically, an extended test of major support (11,990) remains underway.
Conversely, the 12,320-to-12,350 area pivots to resistance.
Widening the view to six months adds perspective.
On this wider view, the Nasdaq has extended a downturn from four-month highs.
Tactically, recall the immediate violation of major support (12,555) — on the first approach — raises a technical question mark.
The subsequent downside follow-through under next support (12,320) signals bearish momentum is intact.
More immediately, the Nasdaq is pressing major support (11,990) matching the 50-day moving average, currently 11,991. The 50-day is a widely-tracked intermediate-term trending indicator, and previously marked a July inflection point.
Looking elsewhere, the Dow Jones Industrial Average has also extended its August downturn.
Here again, the prevailing pullback places the 50-day moving average, currently 32,116, firmly under siege.
Separately, consider that last week’s low (32,278) matched major support (32,272) — an area detailed repeatedly — to punctuate Friday’s massive 1,008-point single-day plunge. This area pivots to resistance.
Meanwhile, the S&P 500 has extended a downdraft from its 200-day moving average, a widely-tracked longer-term trending indicator.
The relatively aggressive downturn places the index back under key support points around 4,090 and 4,170.
The bigger picture
As detailed above, the major U.S. benchmarks have extended an August downturn, pressured after hawkish Federal Reserve policy guidance, as well as the ECB’s nearly concurrent tightening bias.
In the process, each big three U.S. benchmark has violated major support — (each index has violated several key levels) — pulling in to retest the 50-day moving average.
Moving to the small-caps, the iShares Russell 2000 ETF (IWM) has extended a downturn from four-month highs.
Tactically, the 50-day moving average, currently 182.96, closely matches next support (182.80).
More broadly, the prevailing pullback punctuates a jagged test of the 200-day moving average from underneath.
Similarly, the SPDR S&P MidCap 400 ETF (MDY) has extended a pullback from the 200-day moving average.
In the process, the MDY has violated its breakout point (460.00), pulling in to challenge deeper support, circa 454.00.
Returning to the S&P 500, its August downturn accelerated after Friday’s hawkish Fed policy remarks.
In the process, the index violated major support — around 4,090 and 4,170 — amid an aggressive single-day downdraft (long red bar).
Underlying the downturn, Friday’s market breadth registered bearish extremes: NYSE declining volume surpassed advancing volume by a 9-to-1 margin.
So collectively, the S&P has stalled at its 200-day moving average, and subsequently knifed through two support points, amid a 9-to-1 down day. Bearish price action.
Tactically, the August downdraft confirms the primary downtrend, a trend defined by the 200-day moving average.
Moreover, the decisive violation of major support — around 4,090 and 4,170 — likely wrecks the S&P 500’s recovery attempt. At least for now.
From current levels, the 4,090 area pivots to resistance. A swift reversal higher would place the brakes on bearish momentum.
Conversely, the 50-day moving average, currently 4,009, is followed by support at 3,945, and a firmer floor in the 3,900-to-3,918 area.
Beyond specific levels, Wednesday’s monthly close may add color leading in to September, the S&P 500’s worst month seasonally.
Editor’s Note: The next review will be published Tuesday, Sept. 6.
Watch List
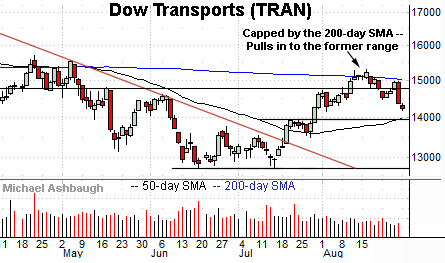
Drilling down further, the Dow Transports (TRAN) have reversed from four-month highs.
The prevailing downturn punctuates a failed test of the 200-day moving average, currently 15,005, a widely-tracked longer-term trending indicator.
The group’s primary downtrend is intact.
Delving deeper, near-term support (13,950) roughly matches the 50-day moving average, currently 14,001. Tactically, a violation of this area would signal sustained bearish momentum, likely wrecking the transports’ recovery attempt.
Meanwhile, the Financial Select Sector SPDR (XLF) has stalled at its range top.
Recall notable resistance rests in the 35.60-to-35.75 area. (See the Aug. 11 review.)
The August closing peak (35.81) registered nearby — established Aug. 16 — and selling pressure has surfaced.
More immediately, the group’s 50-day moving average, currently 33.08, has marked an inflection point. (See the July trendline breakout.) An eventual violation of this area would strengthen the intermediate-term bear case.
Looking elsewhere, the Utilities Select Sector SPDR (XLU) is acting well technically. (Yield = 2.8%.)
Earlier this month, the group briefly tagged record highs, edging atop the April peak.
More immediately, the prevailing pullback has been flattish — signaling muted selling pressure — and underpinned by the breakout point (75.40). A sustained posture atop this area signals a firmly-bullish bias.
Moving to specific names, Dow 30 component Apple, Inc. (AAPL) — most recently profiled Aug. 4 — has reached a headline technical test.
Specifically, the shares have pulled in to the 200-day moving average, currently 161.00. (Recall the late-July break atop the 200-day moving average, fueled by the company’s strong quarterly results.)
Delving slightly deeper, gap support (159.50) remains an inflection point.
Tactically, a violation of the 159.50 area would raise a question mark, placing Apple’s rally attempt in doubt.
On further weakness, the 50-day moving average, currently 155.60, is followed by firmer support, circa 150.80. (Also see the July 7 review, amid Apple’s trendline breakout.)
Finally, Amazon.com, Inc. (AMZN) has balked at a headline technical test.
As illustrated, the shares have reversed from four-month highs, pressured amid a failed test of the 200-day moving average from underneath.
The prevailing pullback places the shares under gap support (130.75) — detailed previously — raising a technical question mark. (See the Aug. 4 review.)
More broadly, the late-July gap higher punctuated a double bottom — defined by the May and June lows — after the company’s second-quarter results.
Tactically, the 50-day moving average is rising toward major support matching the breakout point (125.50). An eventual violation of this area would likely wreck Amazon’s recovery attempt.
(Consider that Amazon’s recent backdrop resembles that of the Dow Transports, detailed above, in key respects.)


