Charting a bull-bear stalemate, S&P 500 vies to stabilize amid seasonal headwind
Focus: Crude oil prices clear key trendline, Cisco Systems digests earnings-fueled breakout, USO, XLE, XLP, XRT, CSCO
Technically speaking, the U.S. benchmarks are vying to stabilize in the wake of a respectable downturn from four-month highs.
Against this backdrop, several benchmarks have maintained near-term support — which is constructive — but have subsequently flatlined ahead of the Federal Reserve’s policy guidance. The weekly close will likely add color.
Editor’s Note: As always, updates can be directly accessed at https://chartingmarkets.substack.com.
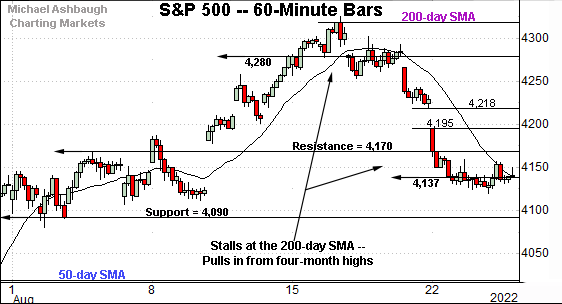
Before detailing the U.S. markets’ wider view, the S&P 500’s hourly chart highlights the past four weeks.
As illustrated, the S&P is digesting a downturn from the 200-day moving average.
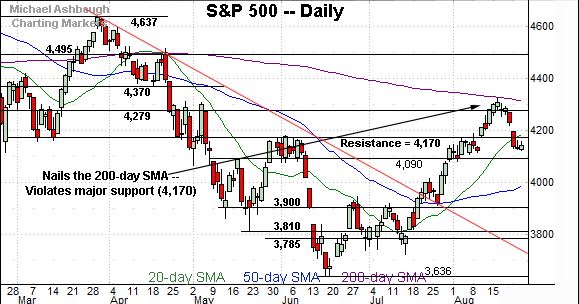
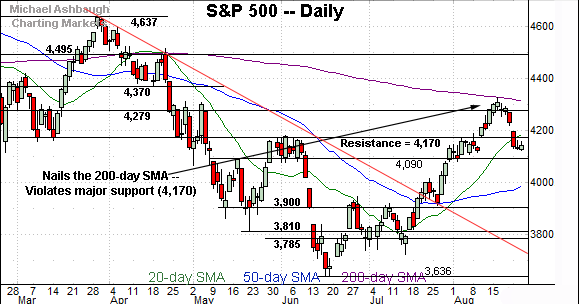
Tactically, the 4,170 area remains a headline inflection point, a level better illustrated on the daily chart.
(On a granular note, S&P 4,137 marks the mid-point of the downturn from the March peak (4,637) to the June low (3,636) — the 50% retracement. The S&P’s mid-week close (4,140) registered nearby.)
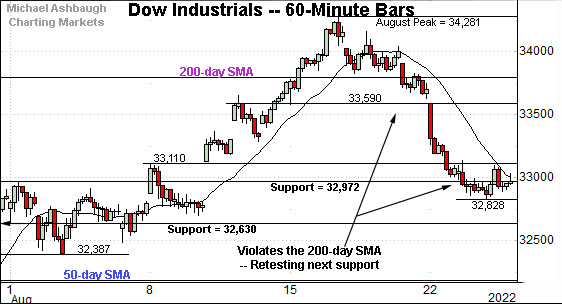
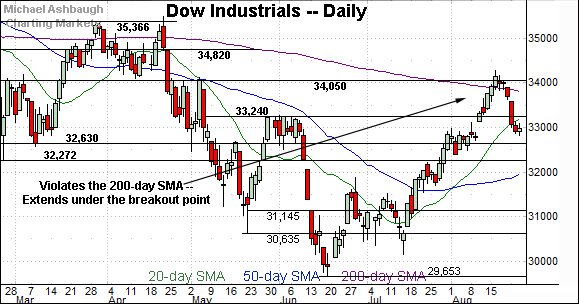
Meanwhile, the Dow Jones Industrial Average is digesting a violation of its 200-day moving average.
Tactically, the index has stabilized near next support (32,972) detailed previously. Wednesday’s close (32,969) registered within three points.
Delving deeper, the 32,630 area marks an inflection point, also detailed on the daily chart.
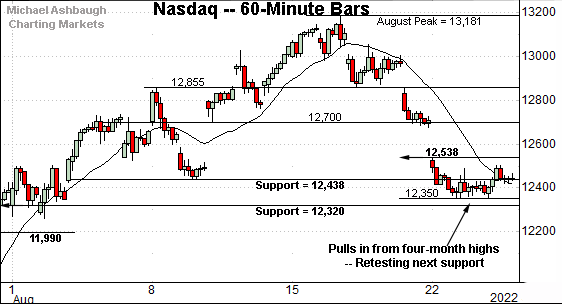
Against this backdrop, the Nasdaq Composite is digesting a downturn from the August peak.
Here again, the index seems to have stabilized near an inflection point (12,438) detailed previously. Wednesday’s close (12,431) registered nearby.
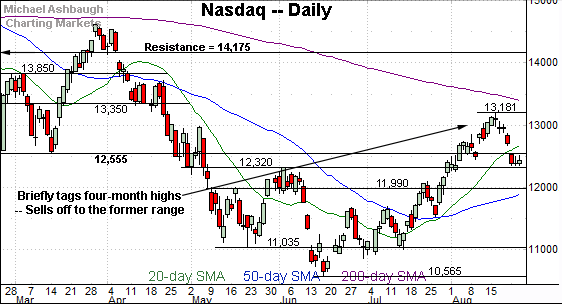
Widening the view to six months adds perspective.
On this wider view, the Nasdaq is digesting a downdraft from four-month highs.
Tactically, recall the immediate violation of major support (12,555) — on the first approach — raises a technical question mark.
This area would be expected to draw buyers if a durable uptrend were in play. Instead, three consecutive closes have registered lower.
Delving deeper, the 12,320 area remains a notable floor.
Looking elsewhere, the Dow Jones Industrial Average has extended a downturn from four-month highs.
Here again, the index has violated major support — the mid-August breakout point (33,240), detailed previously — on the the first approach.
More broadly, the prevailing pullback punctuates a fleeting false break atop the 200-day moving average at the August peak.
Meanwhile, the S&P 500 has staged the U.S. benchmarks’ headline technical event.
Specifically, the index has reversed sharply from its 200-day moving average, a widely-tracked longer-term trending indicator.
Recall the August peak registered within one point of the 200-day moving average. The subsequent downdraft signals the primary downtrend is intact for now.
The bigger picture
As detailed above, the U.S. benchmarks are vying to stabilize in the wake of a respectable downturn from four-month highs.
The prevailing pullback has registered just ahead of September — the S&P 500’s worst month seasonally — and the Federal Reserve’s widely-anticipated policy guidance. (August is historically the S&P 500’s second-worst month.)
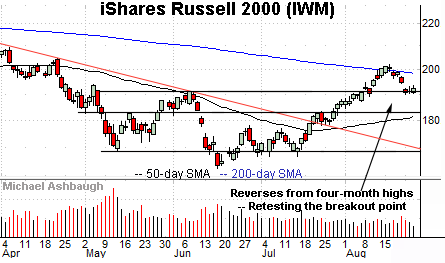
Moving to the small-caps, the iShares Russell 2000 ETF (IWM) seems to have stabilized, for the near-term, amid a pullback from four-month highs.
Tactically, an extended retest of the breakout point (190.90) remains underway.
More broadly, the prevailing downturn punctuates a jagged test of the 200-day moving average from underneath.
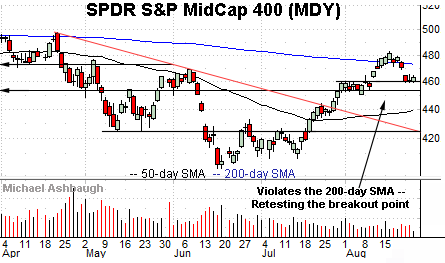
Similarly, the SPDR S&P MidCap 400 ETF (MDY) has pulled in to support from a mid-month test of the 200-day moving average.
Here again, the prevailing downturn has been underpinned by the breakout point (460.00).
Returning to the S&P 500, the index is digesting a downdraft from the 200-day moving average.
Against this backdrop, the immediate violation of the 4,170 area — on the first approach — raises a technical question mark. This area would be expected to offer support if a durable uptrend were in play.
The bearish reversal from the 200-day moving average signals the primary downtrend is intact.
More immediately, the 4,090-to-4,170 area remains an intermediate-term caution zone.
Tactically, a violation of the 4,090 area would signal sustained bearish momentum, likely wrecking the S&P 500’s recovery attempt. Conversely, a rally back atop S&P 4,170 would signal the rally attempt’s potential viability.
Beyond technical levels, the weekly close — following the Federal Reserve’s policy guidance — and next week’s monthly close will likely add color.
(On a granular note, S&P 4,137 marks the mid-point, or 50% retracement, of the downturn from the March peak (4,637) to the June low (3,636). The S&P’s mid-week close (4,140) registered nearby, and this area has marked an August inflection point.)
Watch List
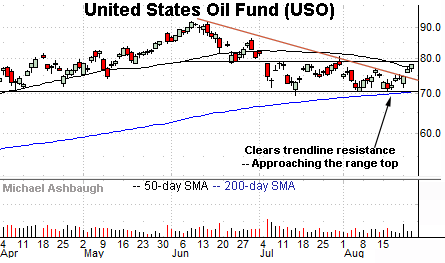
Drilling down further, the United States Oil Fund (USO) is showing signs of life technically. The fund tracks the spot price of light, sweet crude oil.
As illustrated, the shares have cleared trendline resistance, rising to edge atop the 50-day moving average, currently 77.00.
The prevailing upturn has been fueled by increased volume, placing the range top (79.20) just overhead. Follow-through atop this area would mark a material “higher high” confirming the trend shift.
Tactically, the trendline, circa 74.50, pivots to support. The prevailing rally attempt is intact barring a violation.
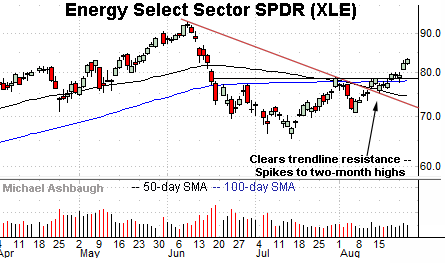
Moving to U.S. sectors, the Energy Select Sector SPDR (XLE) — profiled Aug. 18 — has broken out amid a broad-market pullback. (Yield = 3.6%.)
The prevailing upturn places the group at two-month highs, and originates from trendline support.
Tactically, gap support (80.55) is followed by the firmer breakout point (78.60). A sustained posture atop this area signals a bullish intermediate-term bias.
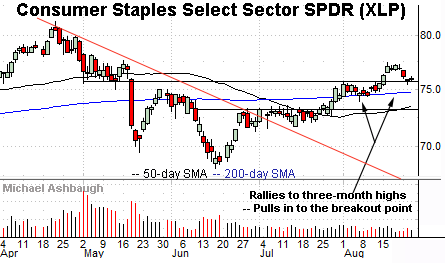
Meanwhile, the Consumer Staples Select Sector SPDR (XLP) is also acting well technically. (Yield = 2.4%.)
As illustrated, the group is digesting a recent breakout, staging an orderly pullback from the August peak.
Tactically, the breakout point (75.40) is closely followed by the 200-day moving average, currently 74.76, a recent bull-bear inflection point. The prevailing rally attempt is intact barring a violation.
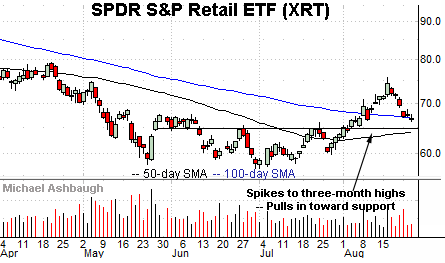
Looking elsewhere, the SPDR S&P Retail ETF (XRT) is perhaps surprisingly well positioned.
Technically, the prevailing pullback places the group near its 100-day moving average, currently 66.80, and 13.7% under the August peak.
Slightly deeper support matches the breakout point (64.75) a level toward which the 50-day moving average (64.18) is rising. The group’s rally attempt is intact barring a violation of this area.
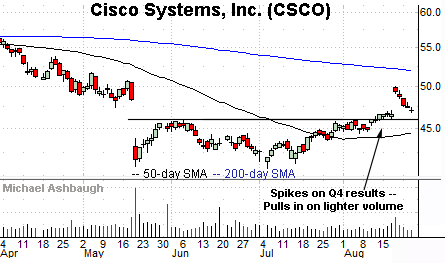
Finally, Dow 30 component Cisco Systems, Inc. (CSCO) — initially profiled Aug. 4 — remains well positioned. (Yield = 3.2%.)
Earlier this month, the shares knifed to three-month highs, gapping sharply higher after the company’s fourth-quarter results.
The subsequent pullback has filled the gap, placing the shares 6.2% under the August peak. (Wednesday’s close (47.07) effectively matched the bottom of the gap (47.10).)
Tactically, the breakout point (45.90) marks a firmer, and slightly deeper, floor. A sustained posture atop this area signals a bullish bias.


