Charting a bullish reversal: S&P 500, Nasdaq maintain major support
Focus: Semiconductor sector approaches record territory, Amazon.com holds the breakout point, SMH, AMZN, ORCL, KR, WING
U.S. stocks are mixed early Thursday, vacillating in the wake of an early-week volatility spike.
Against this backdrop, the S&P 500 and Nasdaq Composite have sustained respectable rallies from major support — the S&P 4,257 and Nasdaq 14,175 areas.
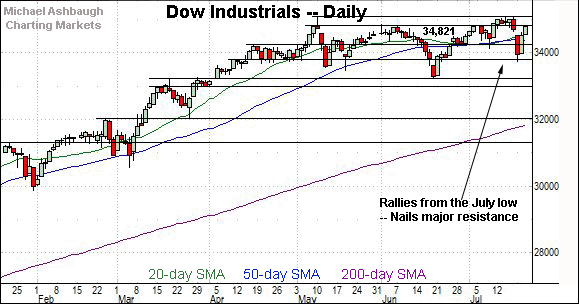
Meanwhile, the Dow Jones Industrial Average has nailed its breakdown point (34,820) amid a retest that remains underway.
Editor’s Note: As always, updates can be directly accessed at chartingmarkets.substack.com.
Before detailing the U.S. markets’ wider view, the S&P 500’s hourly chart highlights the past four weeks.
As illustrated, the S&P has reversed sharply from major support. Recall Monday’s close (4,258) matched the breakout point (4,257) amid a jagged retest.
More immediately, the S&P has rallied to retest its breakdown point (4,361).
Wednesday’s session high (4,359.7) registered nearby.
Similarly, the Dow Jones Industrial Average has knifed to its breakdown point (34,821).
Wednesday’s session high (34,820) registered nearby.
The prevailing upturn punctuates a jagged test of the 33,800 area, also detailed on the daily chart.
Slightly more broadly, recall last week’s high (35,090) missed the Dow’s record high (35,091) by about one point. The failed retest preceded a pronounced whipsaw.
Against this backdrop, the Nasdaq Composite has rallied sharply from major support.
As illustrated, Monday’s session low (14,178) closely matched the Nasdaq’s breakout point (14,175) an area also detailed below.
From current levels, the 14,530 area is followed by gap support (14,414) matching last week’s low (14,413).
Widening the view to six months adds perspective.
On this wider view, the Nasdaq has rallied sharply from major support (14,175), detailed repeatedly. (See for instance, the July 14 review.)
To reiterate, the week-to-date low (14,178) has closely matched the Nasdaq’s breakout point (14,175).
Combined, the successful retest — and bullish reversal — preserve a comfortably bullish intermediate-term bias.
Looking elsewhere, the Dow Jones Industrial Average has whipsawed amid its former range.
The prevailing upturn originates from the 33,800 support, placing the index back atop its 50-day moving average.
More immediately, a retest of the range top (34,821) — an area detailed repeatedly — remains underway.
Recall Wednesday’s session high (34,820) matched resistance.
Meanwhile, the S&P 500 has rallied from major support.
To reiterate, Monday’s close (4,258) matched the breakout point (4,257) amid a successful retest. Constructive price action.
The bigger picture
As detailed above, the major U.S. benchmarks seem to have absorbed the mid-July market downdraft.
In the process, the S&P 500 and Nasdaq Composite have concurrently maintained their first significant floors — the S&P 4,257 and Nasdaq 14,175 areas. Constructive price action.
Moving to the small-caps, the iShares Russell 2000 ETF remains comparably weaker.
Still, the small-cap benchmark has maintained its range bottom — the 209.05-to-2.09.30 area — to preserve a range-bound backdrop.
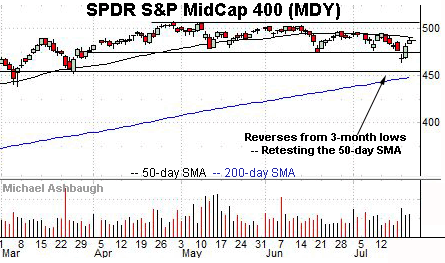
Meanwhile, the SPDR S&P MidCap 400 ETF has reversed back to its range from nearly four-month lows.
Tactically, the 50-day moving average, currently 490.76, has marked a recent sticking point.
Placing a finer point on the S&P 500, the index has rallied sharply from major support.
Recall Monday’s close (4,258) matched the breakout point (4,257) — an area detailed repeatedly — and also illustrated on the daily chart below.
More immediately, a retest of the breakdown point (4,361) remains underway.
More broadly, the S&P has also maintained its 50-day moving average, currently 4,250.
This marks the latest in a series of successful retests — (allowing for single-day closing violations) — going back to early November. Prior retests have marked intermediate-term lows, followed by a resumption of the uptrend.
Against this backdrop, major support now broadly spans from 4,233 to 4,257, levels matching the July low and the breakout point.
An eventual violation would mark a “lower low” — combined with a violation of the 50-day moving average — raising a technical question mark.
Delving deeper, the 4,166 area remains likely last-ditch support.
Beyond technical levels, the S&P 500’s intermediate-term bias remains bullish, based on today’s backdrop, though still narrow sector leadership remains a potential headwind.
Editor’s Note: The next review will be published Monday.
Watch List
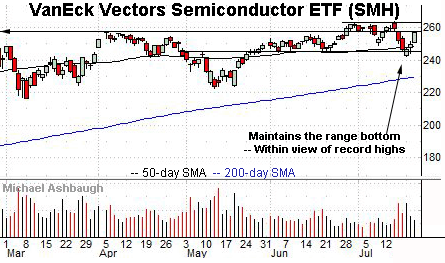
Drilling down further, the VanEck Vectors Semiconductor ETF is acting well technically.
As illustrated, the group has reversed respectably from nearly two-month lows, rising from a successful test of its summer range bottom.
The prevailing upturn places its former range top (257.50) under siege. Slightly more distant overhead (263.86) matches the group’s record peak.
Tactically, notable support spans from 242.10 to 244.80, levels matching the July and June lows. A posture higher signals a bullish bias.
Moving to specific names, Amazon.com is a well positioned large-cap name.
Earlier this month, the shares knifed to record highs, clearing resistance matching the April peak (3,554.00) and August peak (3,552.25).
The ensuing pullback places the shares near the breakout point, and 5.2% under the July peak. (This week’s closing low (3,549.59) roughly matched the breakout point.)
More broadly, Amazon remains well positioned on the five-year chart, rising from a one-year continuation pattern effectively spanning the pandemic. A longer-term target continues to project to the 4,150 area. (Also see the July 7 review.)
Note the company’s quarterly results are due out July 29.
Oracle Corp. is a well positioned large-cap software vendor.
Technically, the shares have staged a bull-flag breakout, reaching all-time highs. A near-term target projects to the 92 area.
Conversely, the breakout point (88.30) is followed by the former range bottom (85.50). The prevailing rally attempt is intact barring a violation.
Kroger Co. is a well positioned large-cap grocery store operator. (Yield = 2.1%.)
The shares started this week with a breakout, tagging a five-year closing high amid increased volume.
By comparison, the ensuing pullback has been orderly, placing the shares near the breakout point (39.80) and 3.5% under the July peak.
Delving deeper, trendline support is rising toward the former range top (38.10). A sustained posture higher signals a bullish bias.
Finally, Wingstop, Inc. is a mid-cap fast-food restaurant operator showing signs of life.
As illustrated, the shares have rallied to the range top, rising to challenge five-month highs. The prevailing upturn punctuates a tight one-month range, laying the groundwork for potentially decisive follow-through.
Tactically, a breakout attempt is in play barring a violation of the prevailing range bottom (152.00).
Editor’s Note: The next review will be published Monday.


