S&P 500 nails the breakdown point (4,280) amid latest failed technical test
Focus: 10-year Treasury yield knifes from the breakout point, Pockets of sector strength (and weakness) persist, TNX, XME, OIH, XLP, XLF
Technically speaking, the major U.S. benchmarks have asserted a holding pattern, vacillating as a volatility spike shows signs of receding.
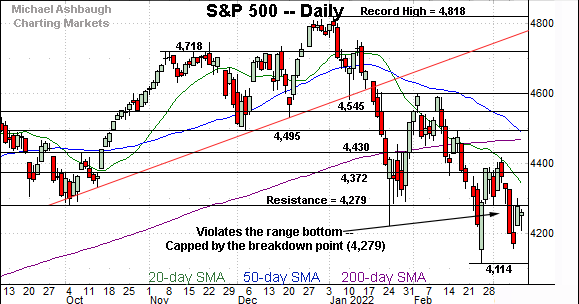
But against this backdrop, the S&P 500 is traversing a lower plateau, capped by familiar resistance matching its breakdown point (4,279).
Editor’s Note: As always, updates can be directly accessed at https://chartingmarkets.substack.com.
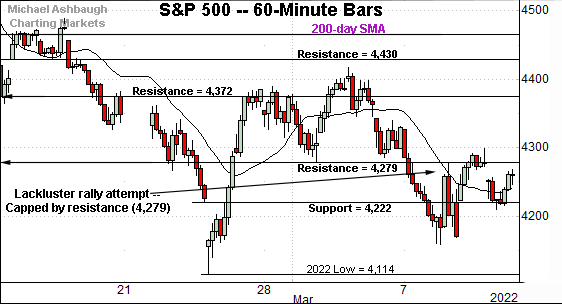
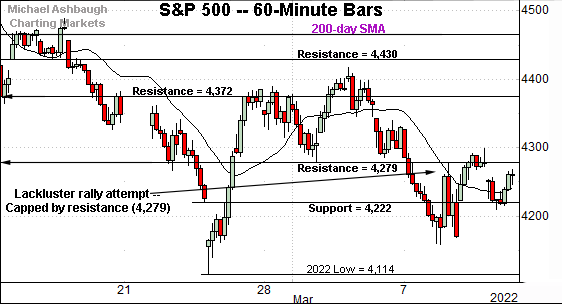
Before detailing the U.S. markets’ wider view, the S&P 500’s hourly chart highlights the past four weeks.
As illustrated, the S&P remains capped by major resistance (4,279), a familiar inflection point detailed repeatedly.
The week-to-date closing high (4,278) has effectively matched resistance. Tuesday’s session high (4,277) also registered nearby.
Conversely, the S&P has reasserted a posture atop next support (4,222) a level matching the January low.
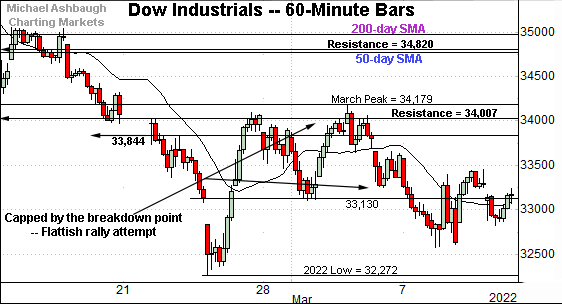
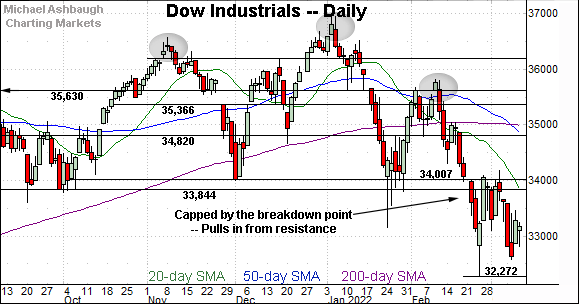
Similarly, the Dow Jones Industrial Average has staged a relatively lackluster rally attempt.
The prevailing upturn has thus far topped firmly under the breakdown point (34,007) a familiar bull-bear fulcrum.
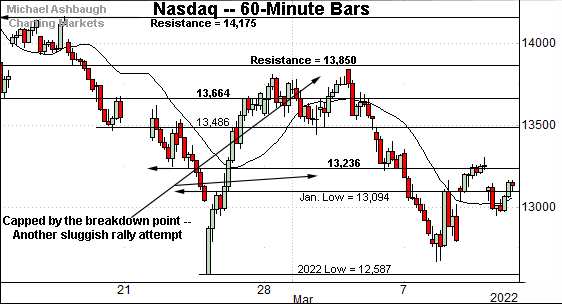
Against this backdrop, the Nasdaq Composite has also registered a flattish March rally attempt.
Here again, the recent upturn has thus far topped firmly under major resistance (13,850), an area also illustrated below.
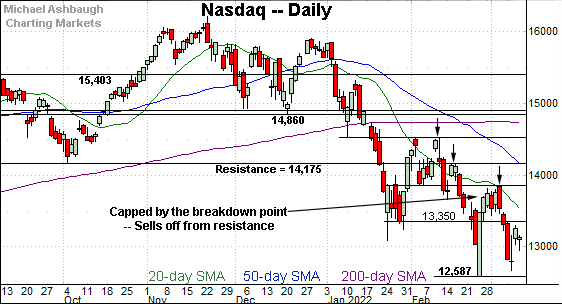
Widening the view to six months adds perspective.
On this wider view, the Nasdaq continues to whipsaw amid a primary downtrend.
The prevailing leg lower originates from the breakdown point (13,850), a familiar technical level detailed last week. The March peak (13,837) — established last week — registered slightly under resistance.
More immediately, the Nasdaq has violated the 13,350 support, an inflection point also detailed last week. The week-to-date peak (13,353) — established Monday — has effectively matched resistance. Tactically, eventual follow-through atop this area would mark an early step toward stabilization.
More broadly, the Nasdaq’s intermediate- to longer-term bias remains firmly bearish.
Looking elsewhere, the Dow Jones Industrial Average has also whipsawed amid a bearish backdrop.
The March leg lower originates from the breakdown point (34,007), a familiar bull-bear fulcrum. The failed retest from underneath preserves a bearish intermediate- to longer-term bias.
More immediately, the prevailing rally from the March low has thus far registered as comparably flat.
Meanwhile, the S&P 500 is also trending broadly lower.
Tactically, the major resistance (4,279) — detailed repeatedly — remains an overhead inflection point.
Against this backdrop, the week-to-date closing high (4,278) — established Wednesday — has matched resistance to punctuate a failed retest from underneath. Tuesday’s session high (4,277) also registered nearby.
The bigger picture
As detailed above, the U.S. benchmarks’ bigger-picture backdrop remains bearish. Aggressive January and February market downdrafts have been punctuated by thus far comparably flat rally attempts.
Amid the downturn, each benchmark has registered a multi-month closing low this week.
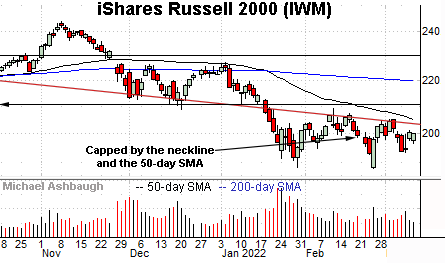
Moving to the small-caps, the iShares Russell 2000 ETF has diverged very slightly from the broad market in recent sessions.
Specifically, the small-cap benchmark has not registered a new closing low this week, outpacing the major U.S. benchmarks.
Tactically, the 50-day moving average, currently 204.60, is closely followed by the March peak (205.30). Follow-through atop this area would mark technical progress.
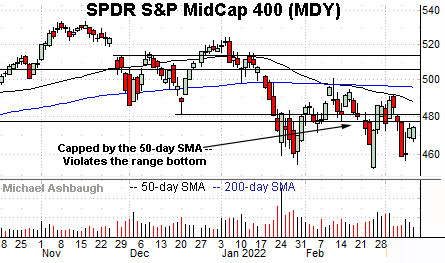
Meanwhile, the SPDR S&P MidCap 400 ETF has re-violated its range bottom (477.50).
Recall the prevailing downturn punctuates a failed test of the 50-day moving average at the March peak.
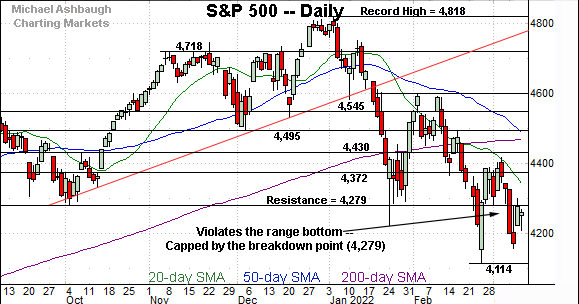
Placing a finer point on the S&P 500, the index remains capped by major resistance (4,279) an inflection point better illustrated below.
More broadly, the S&P 500 earlier this week tagged its lowest close since June 2021 — a nine-month closing low (4,170).
The subsequent lift from the March low has been capped by the breakdown point (4,279), a near-term inflection point, detailed repeatedly.
To reiterate, the week-to-date closing peak (4,278) matched resistance, and Tuesday’s session high (4,277) also registered nearby.
Tactically, sustained follow-through atop the 4,280 area would mark an early step toward stabilization.
Beyond near-term issues, the S&P 500’s more important intermediate- to longer-term bias remains bearish pending extensive repairs.
Editor’s Note: The next review will be published Tuesday.
Watch List
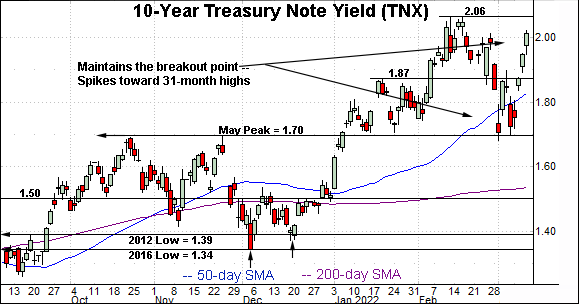
Drilling down futher, the 10-year Treasury note yield (TNX) has asserted a higher plateau.
Specifically, the yield has maintained its breakout point (1.70) a level matching the March closing low (1.71). (Also see the March 4 low (1.70).)
The aggressive upturn from this area places the range top within view.
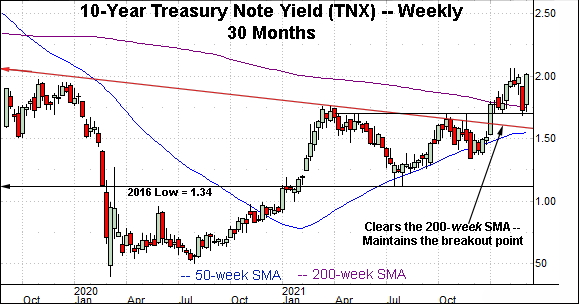
More broadly, the steep March reversal preserves the yield’s posture atop the 200-week moving average, currently 1.75. (See the 30-month chart.)
The successful retest signals a yield-bullish longer-term bias ahead of the Federal Reserve’s next policy directive — including a near-certain quarter-point rate hike — due out next week. (Also see the Feb. 11 review for added context.)
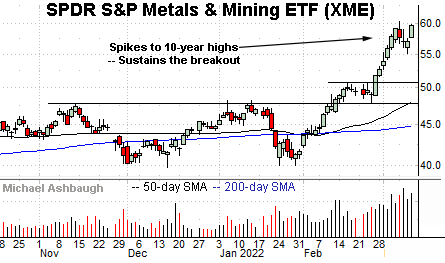
Moving to U.S. sectors, the SPDR S&P Metals & Mining ETF (XME) — most recently profiled March 1 — continues to take flight.
In the process, the group has tagged 10-year highs, rising amid a sustained volume increase.
Tactically, the post-breakout low (55.15) is followed by the breakout point (50.80). A sustained posture higher signals a firmly-bullish bias.
Delving deeper, the group’s massive spike originates from the former range top (47.70), an area detailed previously.
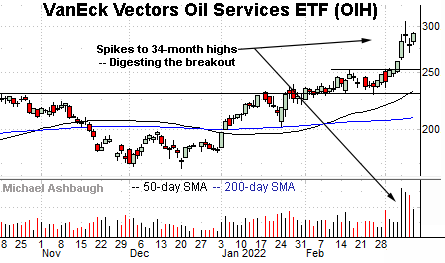
Simiarly, the VanEck Vectors Oil Services ETF (OIH) has taken flight, tagging 34-month highs amid a volume spike.
Here again, the subsequent pullback has been comparably flat, signaling still muted selling pressure despite the strong rally.
Though near-term extended, and due to consolidate, the group is attractive on a pullback. Tactically, the post-breakout low, circa 271.00, is followed by the firmer breakout point (252.80).
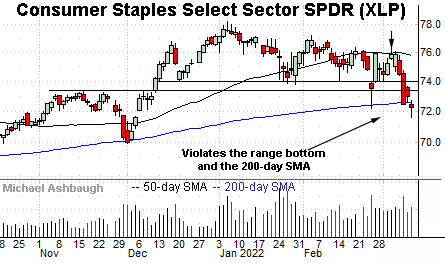
Looking elsewhere, the Consumer Staples Select Sector SPDR (XLP) has taken a bearish turn.
Fundamentally, the group has been pressured amid a growing consensus that Europe is likely headed for a potentially severe recession.
Sector components Coca-Cola (KO), Pepsico (PEP) and Procter & Gamble (PG) account for a combined 35% sector weighting and each is materially exposed to Europe.
To be sure, the group also exhibits defensive traits, including a 2.5% dividend yield, and relatively inelastic demand for its products. Consumers tend to buy the group’s products even amid economic downturns.
Moving to the chart, the group has reached three-month lows, violating the 200-day moving average, currently 72.60. As always, the 200-day is a widely-tracked longer-term trending indicator. (See the December low.)
Tactically, a sustained reversal atop the 200-day moving average — and resistance in the 73.40-to-74.00 area — would place the group on firmer ground.
On a granular note, the prevailing downturn punctuates a failed test of the 50-day moving average at the March peak.
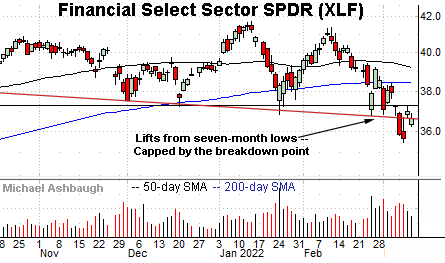
Finally, the Financial Select Sector SPDR (XLF) has also asserted a bearish backdrop.
Earlier this month, the group tagged seven-month lows, violating major support. The downturn punctuates a head-and-shoulders top, detailed March 1. (The pattern is defined by the October, January and February peaks.)
More immediately, the prevailing rally attempt has been comparably flat, fueled by decreased volume, and capped by the breakdown point (37.20). Bearish price action.
Tactically, upside follow-through atop the breakdown point and the more distant 200-day moving average would place the brakes on bearish momentum.


