Charting a bull-bear battle, S&P 500 maintains major support
Focus: Apple challenges major resistance, Verizon's breakout attempt, AAPL, VZ, SCCO, SSRM, ZEN
Technically speaking, the major U.S. benchmarks have maintained familiar support this week, thus far preserving a near-term recovery attempt.
But against this backdrop, each benchmark’s more important intermediate- to longer-term bias remains bearish pending extensive repairs.
Editor’s Note: As always, updates can be directly accessed at https://chartingmarkets.substack.com.
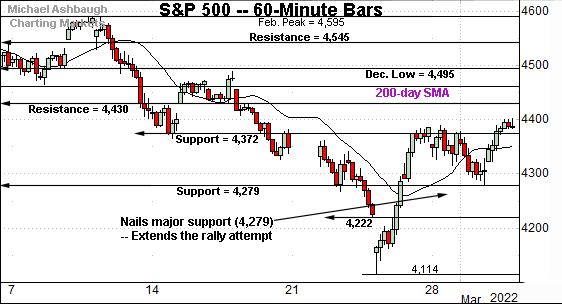
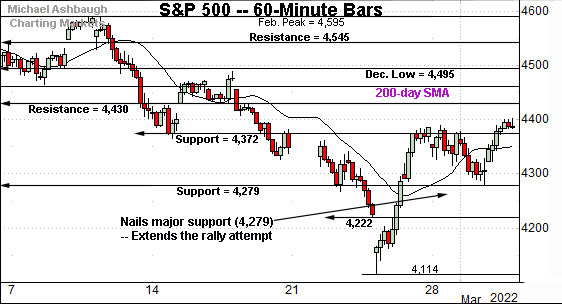
Before detailing the U.S. markets’ wider view, the S&P 500’s hourly chart highlights the past four weeks.
As illustrated, the S&P has maintained major support (4,279) a key bull-bear inflection point detailed Tuesday.
The week-to-date low (4,279.5) — established during Tuesday’s final 10 minutes — precisely matched support, thus far preserving the S&P’s recovery attempt.
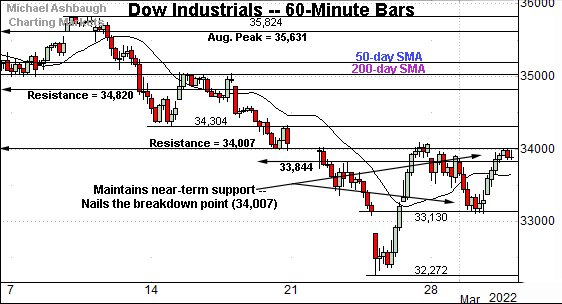
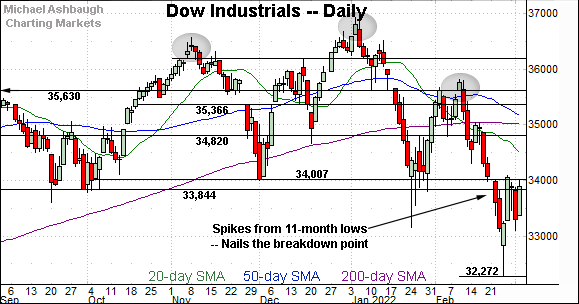
Meanwhile, the Dow Jones Industrial Average has reached a headline technical test.
Specifically, the index is pressing its breakdown point (34,007) a key bull-bear fulcrum detailed repeatedly.
Wednesday’s session high (34,013) registered nearby.
Conversely, the Dow has thus far maintained near-term support — the 33,130-to-33,150 area — the latter maching the January low.
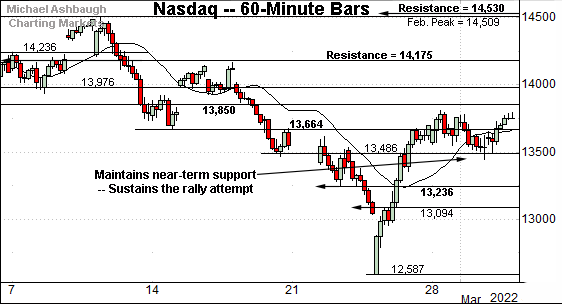
Against this backdrop, the Nasdaq Composite has also sustained its recovery attempt.
In its case, Wednesday’s session low (13,494) roughly matched near-term support (13,486) to punctuate a modest early-March downturn.
The prevailing flag-like pattern — the tight range, hinged to the steep rally — is near-term constructive.
Combined, each big three U.S. benchmark has maintained a familiar support point this week.
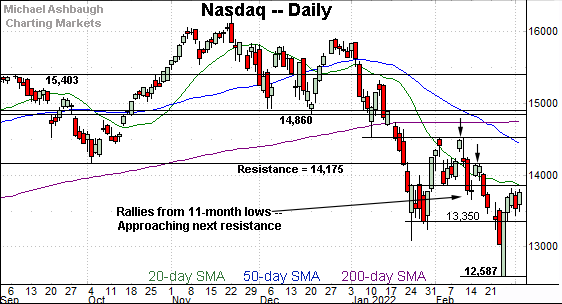
Widening the view to six months adds perspective.
On this wider view, the Nasdaq has sustained its reversal from 11-month lows.
Tactically, the January closing low (13,350) remains an area to work against, a level matching Friday’s session low (13,358). The Nasdaq’s near-term recovery attempt is intact barring a violation.
Conversely, notable overhead matches the mid-February breakdown point (13,850), an area detailed previously.
The week-to-date peak (13,837) — established early Thursday — has registered nearby.
More broadly, the Nasdaq’s intermediate- to longer-term bias remains bearish pending follow-through atop more distant resistance (14,530) and the major moving averages.
Looking elsewhere, the Dow Jones Industrial Average has reached a headline technical test.
Recall the recent downdraft punctuates a head-and-shoulders top, defined by the November, January and February peaks.
Tactically, the Dow’s breakdown point (34,007) — detailed Tuesday — remains a key bull-bear fulcrum. Sustained follow-through atop this area would mark an early step toward stabilization.
Against this backdrop, Wednesday’s session high (34,013) matched resistance, amid an extended retest that remains underway.
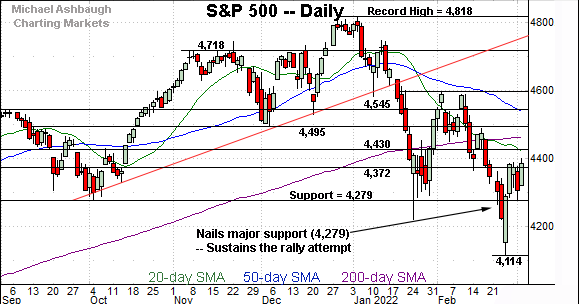
Meanwhile, the S&P 500 has sustained a reversal from nine-month lows.
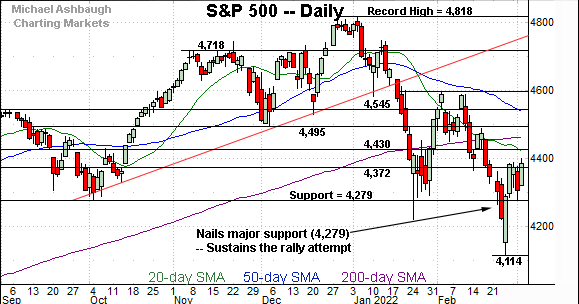
The initial wide-ranging single-day spike from the February low (4,114) has been punctuated by a successful test of major support (4,279).
The bigger picture
As detailed above, the major U.S. benchmarks have thus far sustained a bullish reversal from multi-month lows.
Against this backdrop, each benchmark has maintained familiar support — the S&P 4,279, Dow 13,130 and Nasdaq 13,490 areas. (See the hourly charts.)
So tactically, the prevailing near-term recovery attempt is intact.
But more broadly, and importantly, each benchmark’s intermediate- to longer-term bias remains firmly-bearish pending repairs.
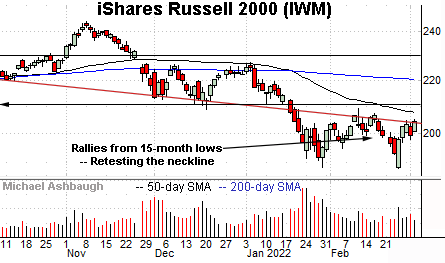
Moving to the small-caps, the iShares Russell 2000 ETF has sustained a reversal from 15-month lows.
Tactically, initial resistance, circa 204.00, is followed by the breakdown point, an area broadly spanning from 208.75 to 211.10. Follow-through atop these areas would mark technical progress.
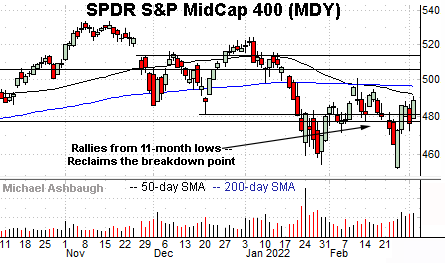
Meanwhile, the SPDR S&P MidCap 400 ETF remains comparably stronger, reclaiming its breakdown point (477.50) and the December low (481.48).
On further strength, the February range top (495.80) is closely followed by the 200-day moving average, currently 496.50.
Placing a finer point on the S&P 500, the index has slightly extended a bullish reversal from the January low.
The prevailing upturn punctuates the S&P’s first 10% correction in two years.
Tactically, the 4,372 area is followed by more important support (4,279) better illustrated below.
More broadly, the S&P 500’s wider view remains surprisingly straightforward, at least as it applies to the immediate backdrop.
Tactically, the 4,280 area remains a bull-bear fulcrum, detailed Tuesday.
This area defines a seven-month range bottom (4,279), and last Thursday’s close (4,288) registered slightly higher to punctuate a massive (4.2%) single-day bullish reversal.
Against this backdrop, the week-to-date low (4,279.5) — established during Tuesday’s final 10 minutes — almost precisely matched support.
Tactically, the S&P 500’s near-term recovery attempt is intact barring a violation of the 4,280 support.
More broadly, the S&P 500’s intermediate- to longer-term bias remains bearish pending extensive repairs. Eventual follow-through atop the 4,430 resistance, and the the 200-day moving average, currently 4,465, would be cause to reconsider the longer-term bias.
Editor’s Note: The next review will be published Monday.
Watch List
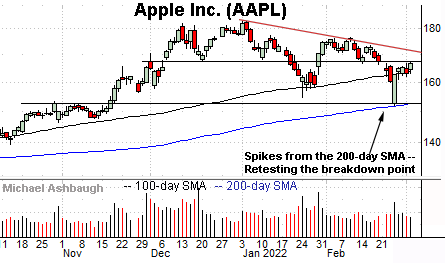
Drilling down further, Dow 30 component Apple, Inc. (AAPL) continues to outperform its so called FAANG peers. (FAANG is the acronym for Facebook, Apple, Amazon, Netflix and Google. Facebook has been renamed Meta Platforms and Google is now Alphabet.)
Technically, Apple has knifed from its 200-day moving average, an area closely matching major support (152.00). The successful retest preserves a bullish longer-term bias.
Amid the upturn, the shares have reclaimed the 100-day moving average, currently 163.85, an area that underpinned the January low.
More immediately, the shares are retesting the breakdown point (167.30). Trendline resistance, circa 170.50, is descending toward the breakdown point.
Tactically, eventual follow-through atop the trendline would signal a bullish intermediate-term trend shift. The prevailing retest from underneath should be a useful bull-bear gauge.
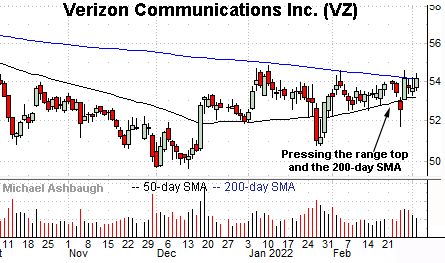
Elsewhere, Verizon Communications, Inc. (VZ) is another Dow 30 component showing signs of life. (Yield = 4.7%.)
As illustrated, the shares are challenging a six-month range top closely matching the 200-day moving average, currently 54.10.
The prevailing upturn punctuates a tight four-week range — a coiled spring — laying the groundwork for potentially decisive follow-through.
Tactically, the 50-day moving average, currently 53.20, has marked an inflection point. A breakout attempt is in play barring a violation.
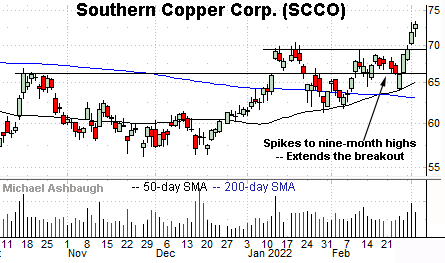
Southern Copper Corp. (SCCO) is a well positioned large-cap copper miner. (Yield = 5.5%.)
Technically, the shares have knifed to nine-month highs, clearing resistance matching the January peak. The prevailing upturn marks an unusually strong two standard deviation breakout, encompassing consecutive closes atop the 20-day volatility bands.
Though near-term extended — and due a cooling-off phase — the nearly straightline spike is longer-term bullish. Tactically, the prevailing rally attempt is intact barring a violation of the breakout point (69.50).
Separately, notice the recent golden cross, or bullish 50-day/200-day moving average crossover. The prevailing upturn originates from recent successful tests of the 50-day moving average.
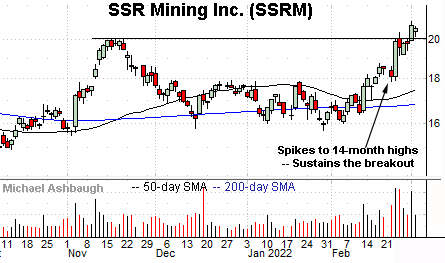
SSR Mining, Inc. (SSRM) is a mid-cap miner of precious and base metals. (Yield = 1.4%.)
As illustrated, the shares have started March with a strong-volume breakout, reaching 14-month highs.
By comparison, the immediate pullback has been flat, fueled by decreased volume. Tactically, a sustained posture atop the breakout point (20.05) signals a firmly-bullish bias.
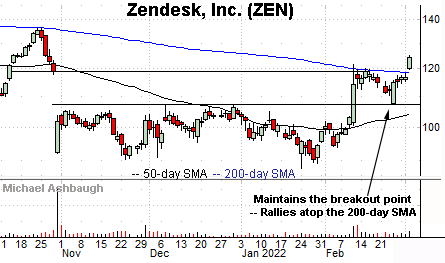
Finally, Zendesk, Inc. (ZEN) is a large-cap software vendor coming to life.
The shares initially spiked three weeks ago, knifing to four-month highs after the company rejected a takeover bid, and reported its quarterly results.
The ensuing pullback has been underpinned by the breakout point, and punctuated by a decisive break atop the 200-day moving average, currently 118.55.
Tactically, the 200-day moving average has marked an inflection point at the October and February peaks. The prevailing rally attempt is intact barring a violation.


