Charting (another) corrective bounce, S&P 500 challenges the breakdown point
Focus: Global markets diverge, Europe and Japan violate major support as S&P 500 exhibits relative strength, IEV, EWJ, FXI, SPY
Technically speaking, the major U.S. benchmarks continue to whipsaw, vacillating amid a prolonged volatility spike.
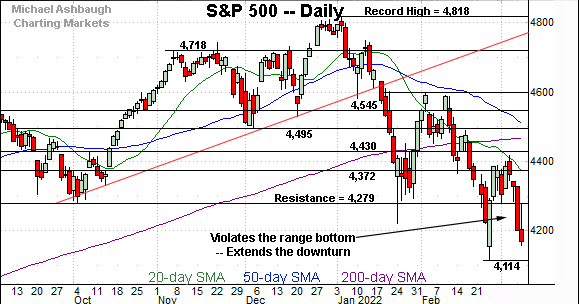
Against this backdrop, the S&P 500 is back for its latest crack at the breakdown point (4,279) rising to this week’s second retest from underneath.
Editor’s Note: As always, updates can be directly accessed at https://chartingmarkets.substack.com.
Before detailing the U.S. markets’ wider view, the S&P 500’s hourly chart highlights the past four weeks.
As illustrated, the S&P has violated major support (4,279), a familiar inflection point also detailed on the daily chart.
The index subsequently failed its initial retest from underneath. Tuesday’s session high (4,277) closely matched resistance.
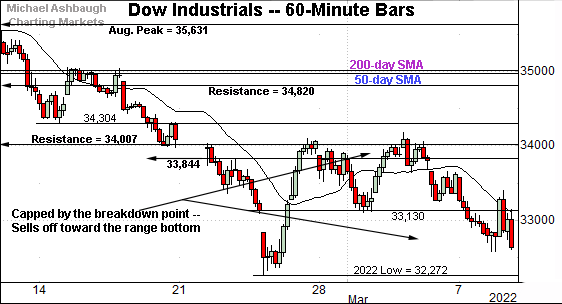
Similarly, the Dow Jones Industrial Average has approached its range bottom.
Recall the prevailing pullback originates from the breakdown point (34,007) a key bull-bear fulcrum detailed repeatedly.
More immediately, the 33,130 area remains a near-term inflection point.
Against this backdrop, the Nasdaq Composite has also whipsawed amid jagged price action.
Here again, the prevailing downturn originates from major resistance (13,850), an area also illustrated below.
More immediately, the Jan. low (13,094) remains a near-term inflection point.
Widening the view to six months adds perspective.
On this wider view, the Nasdaq has sold off aggressively from the mid-February breakdown point (13,850), a familiar level detailed last week.
Last week’s high (13,837) registered slightly under resistance.
More immediately, the Nasdaq has violated the 13,350 support, an inflection point also detailed last week.
The week-to-date high (13,353) — established Monday — has registered nearby. Tactically, eventual follow-through atop this area would mark an early step toward stabilization.
More broadly, the Nasdaq’s intermediate- to longer-term bias remains firmly bearish.
Looking elsewhere, the Dow Jones Industrial Average has also failed a headline technical test.
Recall the Dow’s recent downdraft punctuates a head-and-shoulders top, defined by the November, January and February peaks.
The subsequent rally attempt has been capped by the breakdown point (34,007), a familiar bull-bear fulcrum. The failed retest from underneath preserves a firmly-bearish intermediate- to longer-term bias.
Separately, the Dow’s death cross — or bearish 50-day/200-day moving average crossover — did indeed signal Tuesday. Though frequently a lagging indicator, the crossover signals that the intermediate-term downtrend has overtaken the longer-term trend.
Meanwhile, the S&P 500 also continues to broadly trend lower.
In the process, the index has violated major support (4,279).
Tactically, Tuesday’s session high (4,277) registered nearby. An extended retest from underneath remains underway.
The bigger picture
As detailed above, the major U.S. benchmarks continue to whipsaw, vacillating amid a prolonged volatility spike.
Amid the cross currents, the Dow industrials and Nasdaq Composite have concurrently registered their lowest closes since March 2021. Elsewhere, the S&P 500 has notched its lowest close since June 2021.
Moving to the small-caps, the iShares Russell 2000 ETF remains capped by trendline resistance.
Tactically, the March peak (205.30) is followed by the breakdown point, an area broadly spanning from 208.75 to 211.10.
More broadly, the small-cap benchmark has not registered a new closing low this week, outpacing the major U.S. benchmarks.
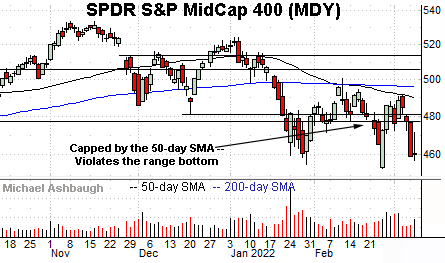
Meanwhile, the SPDR S&P MidCap 400 ETF has re-violated its range bottom — the 477.50 area.
Recall the prevailing downturn punctuates a failed test of the 50-day moving average at the March peak.
Placing a finer point on the S&P 500, the index has violated major support (4,279) an area also detailed on the daily chart.
Tactically, Tuesday’s session high (4,277) and Wednesday’s early session high (4,283) registered nearby amid a retest from underneath.
Separately, the 4,222-to-4,225 area marks a deeper inflection point, detailed Monday. Wednesday’s early session low (4,223) has matched the inflection point.
Despite the wide-ranging price action, the S&P 500 has at least observed headline technical levels.
More broadly, the S&P 500 has registered its lowest close (4,170) in nearly nine months, going back to June 2021.
Tactically, the 4,279 area remains an inflection point.
This week’s decisive violation — punctuated by consecutive closes firmly lower — wrecks the S&P 500’s prior recovery attempt.
Nonetheless, sustained follow-through atop the 4,280 area would mark an early step toward stabilization. The extended retest of this area is worth tracking.
Beyond near-term issues, the S&P 500’s more important intermediate- to longer-term bias remains bearish pending extensive repairs.
As always, it’s not just what the markets do, it’s how they do it. The next several sessions, and the response to next week’s Federal Reserve policy directive, will likely add color.
Watch List — Global markets diverge amid downturn
Drilling down futher, the prevailing market downturn has, perhaps not surprisingly, inflicted broadly-based global-market damage. Amid the carnage, inflential regions have diverged.
Each chart below is a nine-year view. Each bar on the chart represents one month.
To start, the iShares Europe ETF (IEV) has violated major support (50.00), an area formerly defining a seven-year range top.
A retest of the 50-month simple moving average (SMA) is currently underway.
More broadly, the Europe ETF has pulled in as much as 20.6% from the Nov. 2021 peak, a level defining a 13-year high. (The shares are not pulling in from all-time highs.)
Similarly, the iShares MSCI Japan ETF (EWJ) has violated major support (62.90) an area formerly defining a 30-month range top.
Here again, the downturn places the 50-month moving average under siege.
Against this backdrop, the Japan ETF has pulled in as much as 21.5% from the Sept. 2021 peak, a level defining its all-time high.
Looking elsewhere, the iShares China Large-Cap ETF (FXI) has reached six-year lows, pressured amid a more damaging downdraft.
Tactically, the breakdown point (36.60) pivots to major resistance. (See the massive double top defined by the 2018 and 2021 peaks.)
More broadly, the China ETF has pulled in as much as 43.2% from the Feb. 2021 peak, a level defining a 13-year high.
(Like Europe, the China ETF topped in 2007 — just before the U.S. housing-fueled financial crisis — and has not subsequently revisited the record high.)
Finally, the SPDR S&P 500 ETF (SPY) — a U.S. market proxy — remains strikingly stronger than the other regions.
On a headline basis, the prevailing downturn spans just 14.4% from the Jan. 4, 2022 peak, a level defining its all-time high.
Against this backdrop, the ascending 50-month moving average remains distant, about 19.3% under current levels. (The other regions have at least tagged, if not ventured firmly under the trending indicator.)
Separately, each other region has retracted at least as far as the 2018 peak.
Fundamentally, the S&P 500’s relative strength can be at least partly reconciled by the U.S. markets’ perceived safe-haven status versus other regions.
Still, market bears might contend the prevailing 14% downturn is not sufficient to price for the prevailing economic and geopolitcal backdrop. Time will tell.


