Charting a corrective bounce, S&P 500 balks at resistance as rally attempt seems to fade
Focus: Energy and Metals & Mining sectors continue to outperform, Financials reach key technical test, Charting extensive global market damage, XLE, XME, XLF, IEV, FXI, EEM
Technically speaking, the major U.S. benchmarks are off to a less-than-stellar March start, pressured amid heightened geopolitical tensions.
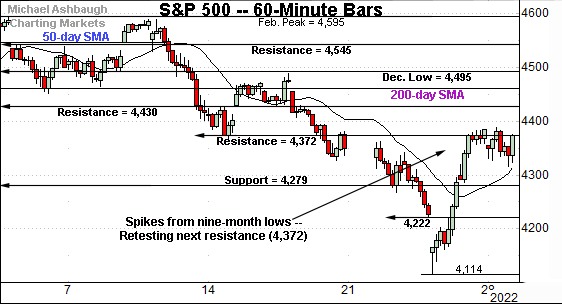
Against this backdrop, the S&P 500’s latest rally attempt has stalled near familiar resistance (4,372) an area that has initially drawn respectable selling pressure.
Editor’s Note: As always, updates can be directly accessed at https://chartingmarkets.substack.com.
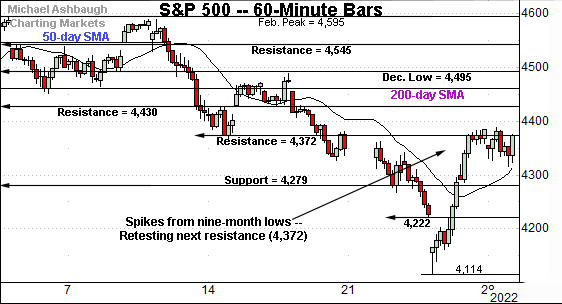
Before detailing the U.S. markets’ wider view, the S&P 500’s hourly chart highlights the past four weeks.
As illustrated, the S&P has rallied to next resistance (4,372), an area detailed previously, and also illustrated on the daily chart.
Monday’s close (4,373.9) registered nearby.
Conversely, the 4,280 area marks a notable downside inflection point, detailed in the next section.
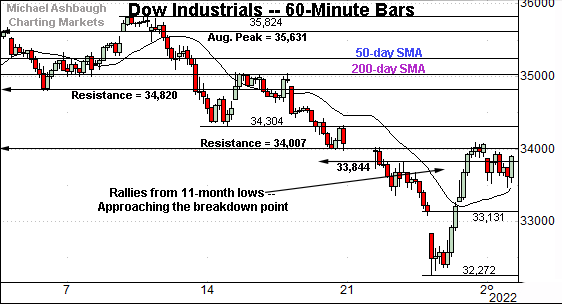
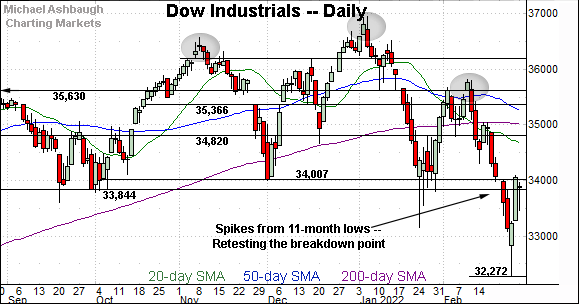
Meanwhile, the Dow Jones Industrial Average has knifed from 11-month lows.
Still, the prevailing rally attempt has stalled near the breakdown point (34,000) an area also detailed on the daily chart.
Tactically, a near-term floor rests in the 33,130-to-33,150 area — detailed Friday — the latter maching the January low.
Tuesday’s early session low (33,136) has effectively matched support.
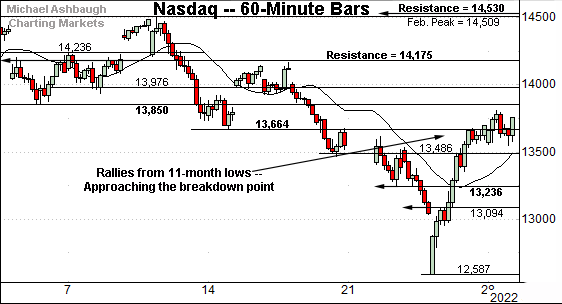
Against this backdrop, the Nasdaq Composite has also reversed from 11-month lows.
From current levels, the 13,850 area marks additional overhead, also illustrated below.
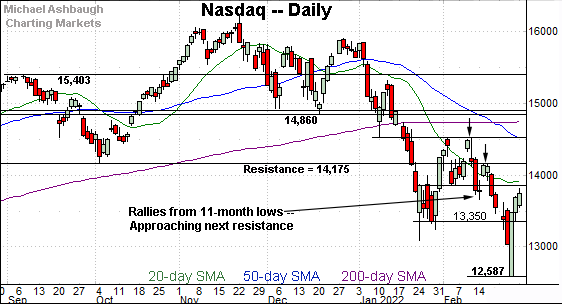
Widening the view to six months adds perspective.
On this wider view, the Nasdaq has rallied sharply from 11-month lows.
Tactically, the January closing low (13,350) remains an area to work against, a level matching Friday’s session low (13,358). The Nasdaq’s near-term recovery attempt is in play barring a violation.
Conversely, notable overhead matches the mid-February breakdown point (13,850), also detailed on the hourly chart.
More broadly, the Nasdaq’s intermediate- to longer-term bias remains bearish pending follow-through atop more distant resistance (14,530) and the major moving averages.
Looking elsewhere, the Dow Jones Industrial Average is vying to neutralize its technical breakdown.
The recent downdraft punctuates a head-and-shoulders top, defined by the November, January and February peaks.
Tactically, the Dow’s breakdown point, circa 34,000, remains a key bull-bear fulcrum. Sustained follow-through atop this area would mark an early step toward stabilization.
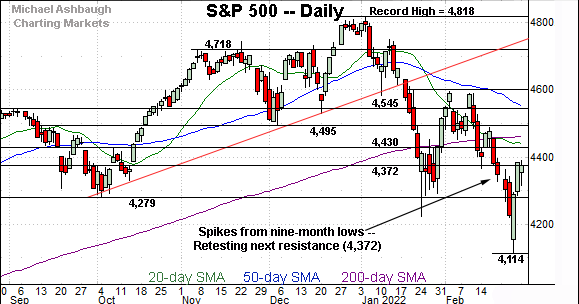
Meanwhile, the S&P 500 has reversed from nine-month lows.
The rally attempt has thus far stalled in the vicinity of next resistance (4,372), an area detailed previously.
The bigger picture
As detailed above, the major U.S. benchmarks continue to whipsaw amid a sustained 2022 volatility spike.
Amid the cross currents, each benchmark’s intermediate- to longer-term bias remains firmly-bearish.
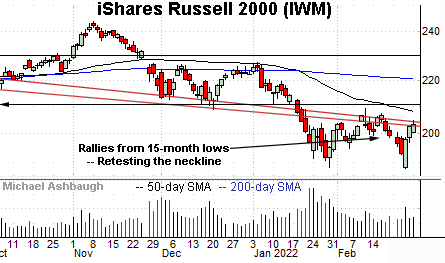
Moving to the small-caps, the iShares Russell 2000 ETF has reversed from 15-month lows.
Tactically, initial resistance, circa 204.00, is followed by the breakdown point, an area broadly spanning from 208.75 to 211.10. Follow-through atop these areas would signal waning bearish momentum.
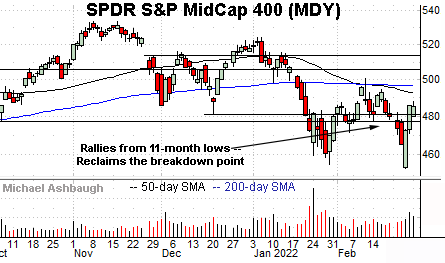
Meanwhile, the SPDR S&P MidCap 400 ETF has reversed more aggressively, reclaiming its breakdown point (477.50) and the December low (481.48).
The rally attempt’s sustainability remains a question mark amid Wednesday’s early downdraft.
On further strength, the 50- and 200-day moving averages closely match the February range top (495.80).
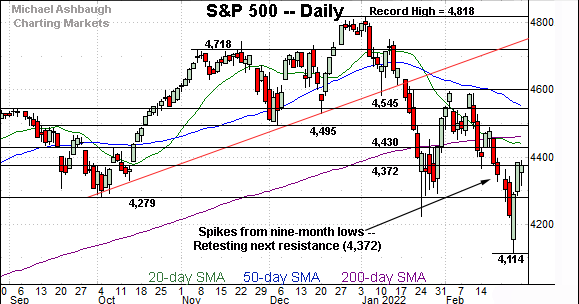
Placing a finer point on the S&P 500, the index has rallied respectably from the January low.
The prevailing upturn punctuates the S&P’s first 10% correction in two years.
More broadly, the S&P 500 has thus far stalled near next resistance (4,372), an area detailed previously.
Monday’s close (4,373.9) registered nearby, and respectable selling pressure has surfaced early Tuesday.
From current levels, the 4,280 area offers an area to work against. This area defines a seven-month range bottom, and Thursday’s close (4,288) registered nearby to punctuate a massive (4.2%) single-day bullish reversal.
Tactically, the S&P 500’s near-term recovery attempt is guardedly intact barring a violation of the 4,280 support.
Beyond near-term bounces, the S&P 500’s more important intermediate- to longer-term bias remains bearish pending extensive repairs. Follow-through atop the 4,430 resistance, and the the 200-day moving average, currently 4,462, would be cause to reassess the longer-term bias.
Editor’s Note: The next review will be published Thursday.
Watch List
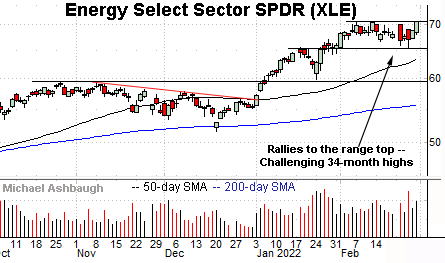
Drilling down further, the Energy Select Sector SPDR (XLE) is acting well technically. (Yield = 3.9%.)
As illustrated, the group has rallied to the range top, rising to challenge 34-month highs.
The prevailing upturn originates from the breakout point (65.50) an area detailed previously. (See the Feb. 2 review.)
Last week’s low (65.36) closely matched support to punctuate a successful retest. On further strength, a near-term target projects to the 74.50 area.
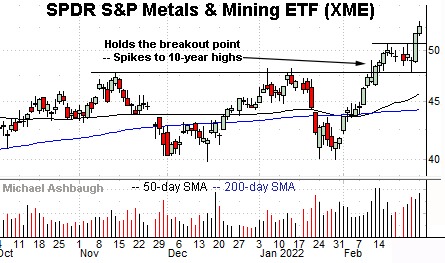
Meanwhile, the SPDR S&P Metals & Mining ETF (XME) — profiled Feb. 16 — has broken out, tagging 10-year highs.
The prevailing upturn originates from the breakout point (47.70), an area detailed previously.
Here again, last week’s low (47.94) registered near support to punctuate a successful retest.
More broadly, the prevailing upturn punctuates a double bottom defined by the November and January lows. From current levels, the former range top, circa 50.80, pivots to support.
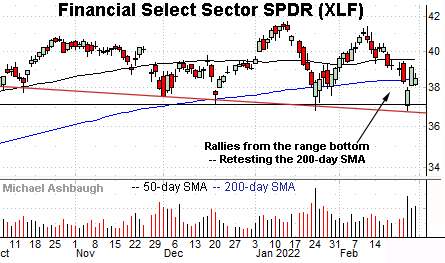
Looking elsewhere, the Financial Select Sector SPDR (XLF) is more tenously positioned versus the prior two sectors.
Nonetheless, the group has maintained its range bottom, rising to retest its 200-day moving average, currently 38.44, from underneath.
On further strength, the slighty more distant 50-day moving average, currently 39.50, has marked an inflection point. (See the December price action.) Follow-through atop this area would place the group on firmer technical ground.
More broadly, notice the developing head-and-shoulders top, defined by the October, January and February peaks. An eventual violation of the February low (36.80) would punctuate the pattern, opening the path to potential swift downside follow-through.
Beyond the U.S. — Charting global market damage
Beyond the U.S., extensive global market damage has been inflicted. Three regions exemplify the prevailing backdrop:
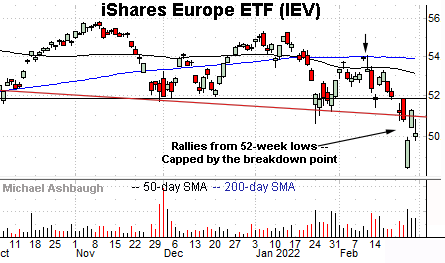
To start, the iShares Europe ETF (IEV) has broken down technically, plunging to 52-week lows.
Tactically, upside follow-through atop trendline resistance (51.00) and the breakdown point (51.80) would mark a step toward stabilization.
More broadly, the prevailing downturn punctuates a failed test of the 200-day moving average at the February peak. Bearish price action.
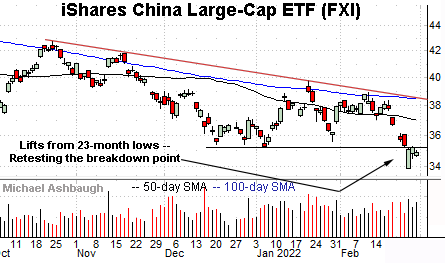
Similarly, the iShares China Large-Cap ETF (FXI) has broken down, tagging 23-month lows.
Tactically, a swift reversal atop the breakdown point (35.30) would place the brakes on bearish momentum. A retest from underneath remains underway.
More broadly, the prevailing downturn punctuates a bearish descending triangle, hinged to the October peak.
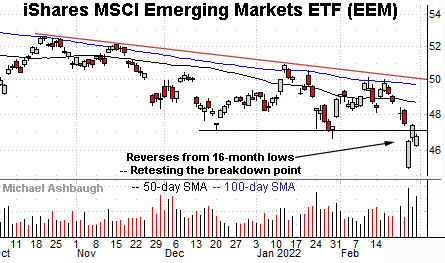
Finally, the iShares MSCI Emerging Markets ETF (EEM) has also staged a technical breakdown.
Tactically, upside follow-through atop the breakdown point (47.10) and the post-breakdown peak (47.40) would mark an early step toward stabilization.
More broadly, relatively extensive damage has been inflicted to the global-market backdrop. Establishing durable lows will more likely be a process than an event.


