Charting a bear-market whipsaw, S&P 500's September rally attempt fades
Focus: Volatility persists amid hotter-than-expected inflation data
Technically speaking, the major U.S. benchmarks continue to whipsaw amid persistently volatile summer price action.
Against this backdrop, the S&P 500 and Dow industrials have rallied respectably from major support — the S&P 3,900 and Dow 31,145 areas — though a hotter-than-expected CPI report has likely capped the rally attempt.
Editor’s Note: As always, updates can be directly accessed at https://chartingmarkets.substack.com.
Before detailing the U.S. markets’ wider view, the S&P 500’s hourly chart highlights the past four weeks.
As illustrated, the S&P has reversed from its range bottom. (Note the U.S. benchmarks are firmly lower Tuesday, not illustrated, pressured after hotter-than-expected consumer price inflation data.)
Tactically, the 50-day moving average, currently 4,040, is followed by support, circa 4,018.
Delving deeper, the 3,900 mark remains a more important floor, also detailed on the daily chart.
Similarly, the Dow Jones Industrial Average is off to a jagged September start.
Tactically, recall the 32,000 area matched the former range top. The Dow has ventured firmly lower early Tuesday.
Delving deeper, the early-month rally attempt originates from major support (31,145) an area better illustrated on the daily chart.
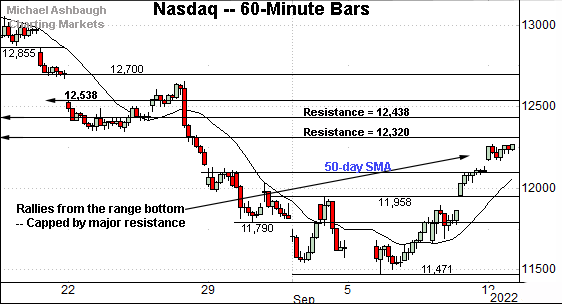
Against this backdrop, the Nasdaq Composite has also reversed toward the middle of its range.
Tactically, the 50-day moving average is followed by gap support (11,958) and an inflection point matching the August low (11,790).
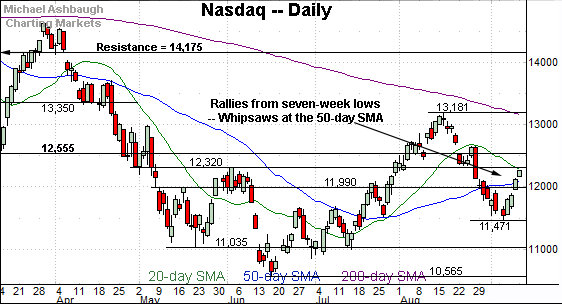
Widening the view to six months adds perspective.
On this wider view, the Nasdaq has whipsawed to start September at its 50-day moving average, currently 12,104.
Delving slightly deeper, the 11,990 area remains an inflection point.
(On a granular note, the 50% retracement of the downturn from the August peak to the September low rests at 12,326, closely matching the 12,320 resistance. This area also defines the June peak (12,320), a level from which the plunge to the 2022 low (10,565) originated.)
Looking elsewhere, the Dow Jones Industrial Average has also reversed from seven-week lows.
Recall the September rally originates from major support (31,145) an area detailed previously.
More immediately, the 50-day moving average, currently 32,247, closely matches the 32,272 resistance. (The June gap, and Feb. low.)
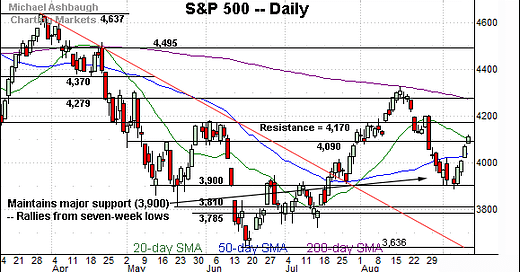
Similarly, the S&P 500 has reversed from major support.
The familiar area matches the May closing low (3,900), the June gap (also 3,900) and the early-summer range top.
More immediately, the index has whipsawed at its 50-day moving average, currently 4,040.
The bigger picture
As detailed above, the major U.S. benchmarks continue to whipsaw amid volatile year-to-date price action.
Against this backdrop, the S&P 500 and Dow industrials have rallied respectably from major support — the S&P 3,900 and Dow 31,145 areas — though Tuesday’s hotter-than-expected inflation data has likely capped the rally attempt.
Moving to the small-caps, the iShares Russell 2000 ETF (IWM) has whipsawed at its 50-day moving average, currently 185.14.
In the process, the September rally attempt seems to have stalled slightly under the former range top (190.90).
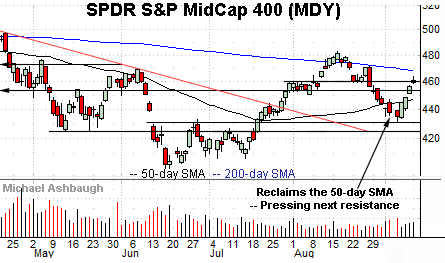
Similarly, the SPDR S&P MidCap 400 ETF (MDY) has whipsawed of late near the 50-day moving average.
Here again, the September upturn has been fueled by decreased relative volume.
More broadly, the small- and mid-cap benchmarks remain capped by the descending 200-day moving average, signaling a longer-term downtrend.
Returning to the S&P 500, the index rallied respectably from the September low.
From bottom to top, the upturn has spanned precisely 6.0% across just five sessions. (The prior downturn spanned 10.1% across about three weeks.)
Tactically, recall the recent market whipsaw originates from the 200-day moving average, a widely-tracked longer-term trending indicator. The August peak registered within one point.
Separately, the 200-day moving average’s slope is descending, also consistent with a primary downtrend.
More immediately, the S&P has whipsawed this week at the 4,090 mark. The 50% retracement of the August-through-September downturn rests nearby, at 4,106.
Combined, the 4,090 area has marked a summer inflection point — detailed previously — and a posture lower signals a bearish-leaning intermediate-term bias.
Delving deeper, the 3,900 mark remains important support. An eventual violation would mark a material “lower low” — to punctuate a downdraft from the 200-day moving average — opening the path to potentially material selling pressure.
Broadly speaking, the S&P 500’s intermediate- to longer-term bias remains bearish based on today’s backdrop.


