Charting a pulling-teeth breakout attempt ahead of the Fed
Focus: China's technical breakdown, Japan continues to test 200-day average, FXI, EWJ, AN, CROX
U.S. stocks are mixed mid-day Wednesday, vacillating ahead of the Federal Reserve’s policy statement, due out this afternoon.
Against this backdrop, each big three U.S. benchmark is digesting a modest late-July break to record territory.
Editor’s Note: As always, updates can be directly accessed at chartingmarkets.substack.com. Your smartphone can also access updates at the same address.
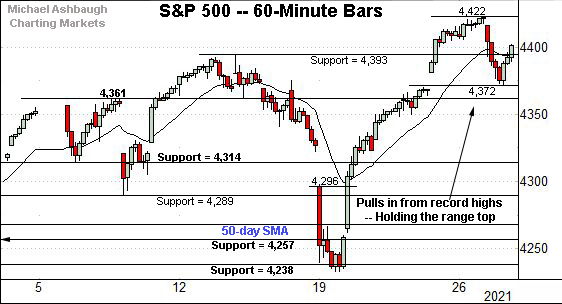
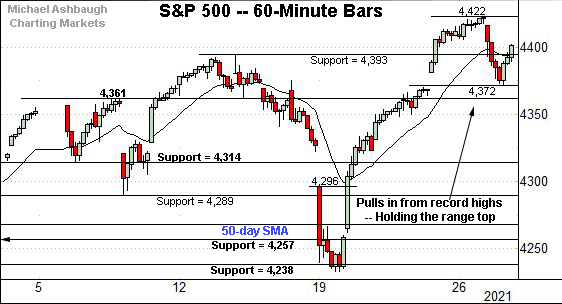
Before detailing the U.S. markets’ wider view, the S&P 500’s hourly chart highlights the past four weeks.
As illustrated, the S&P has sustained a jagged break to record highs.
Tactically, the former range top (4,393) is followed by the week-to-date low (4,372).
Wednesday’s early session low (4,393) has matched support.
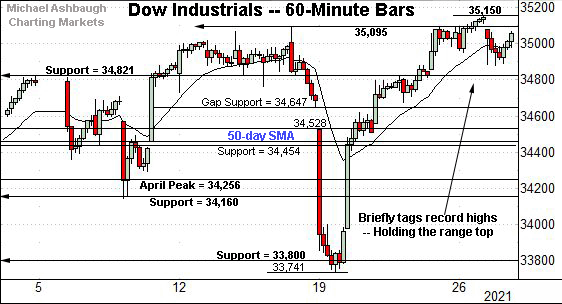
Meanwhile, the Dow Jones Industrial Average is hugging its range top.
The index briefly tagged a record high Monday (35,150), and has since pulled in amid muted selling pressure.
Tactically, notable support matches the former range top (34,820) an area also detailed on the daily chart.
Against this backdrop, the Nasdaq Composite has pulled in to its range from recent record highs.
Recall the prior straightline spike originated from major support (14,175) also illustrated below.
Last week’s low (14,178) — also the July low — closely matched support.
Widening the view to six months adds perspective.
On this wider view, the Nasdaq has pulled in to its range from this week’s nominal record high.
As detailed previously, a near- to intermediate-term target projects to the 15,420 area.
Conversely, the late-July upturn originates from the breakout point (14,175), an area closely matching last week’s low (14,178). Bullish price action.
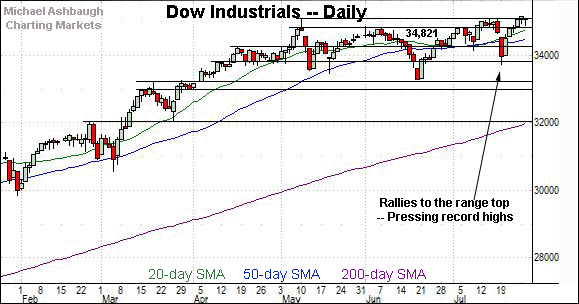
Looking elsewhere, the Dow Jones Industrial Average continues to challenge record highs.
Though Monday’s session high (35,150) marked a nominal record, the breakout attempt technically remains underway.
More broadly, the prevailing upturn punctuates a modified inverse head-and-shoulders pattern, defined by the May, June and July lows.
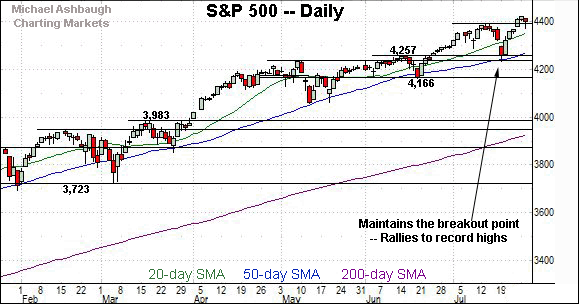
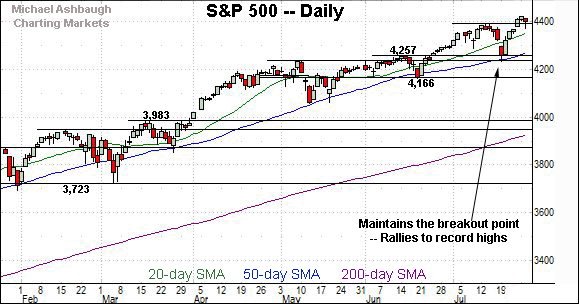
Meanwhile, the S&P 500 is digesting a modest break to record territory.
The prevailing upturn punctuates a jagged test of the breakout point (4,257) a level matching the July closing low (4,258).
The bigger picture
As detailed above, the major U.S. benchmarks continue to act well technically amid largely grinding-higher price action.
On a headline basis, the each big three benchmark tagged a record high Monday, and has since pulled in modestly, pressured amid lackluster selling pressure.
(The Nasdaq Composite experienced respectable selling pressure intraday Tuesday, pressured at least partly in sympathy with China’s downdraft, detailed in the next section. The downturn resembled a lesser version of last week’s bear raid, though ultimately inflicted limited technical damage, as detailed on the hourly chart.)
Moving to the small-caps, the iShares Russell 2000 ETF remains range-bound.
Within the range, the 50-day moving average, currently 224.84, marks an inflection point.
Meanwhile, the SPDR S&P MidCap 400 ETF is digesting a lackluster reversal from nearly four-month lows.
Here again, the 50-day moving average, currently 490.50, remains a sticking point.
Placing a finer point on the S&P 500, the index is digesting its latest break to record highs.
Tactically, the former range top (4,393) is followed by the week-to-date low (4,372).
To reiterate, Wednesday’s early session low (4,393) has matched first support.
Delving deeper, the 50-day moving average, currently 4,272, is followed by the breakout point (4,257) and the July low (4,233).
Tactically, an eventual violation of this area would mark a material “lower low” raising a technical question mark.
Conversely, upside targets continue to project from the July range to the 4,510 and 4,553 areas.
Beyond technical levels, the late-July breakout has not yet been sufficient to confirm the prevailing uptrend. The S&P has thus far registered a moderate 0.65% technical breakout.
Nonetheless, the S&P 500’s intermediate-term bias remains bullish, based on today’s backdrop, though amid still narrow sector leadership. The response to the Federal Reserve’s policy statement will likely add color.
Editor’s Note: The next review will be published Friday.
Watch List
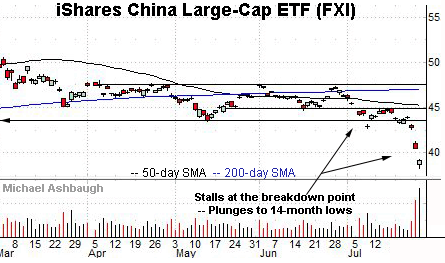
Drilling down further, the iShares China Large-Cap ETF — most recently profiled July 16 — has broken down technically, pressured amid concerns over increased regulatory measures out of Beijing.
The strong-volume downdraft places the shares at 14-month lows, and originates from former breakdown point (44.88). Recall consecutive session highs registered within one cent.
Tactically, gap resistance — at 41.20 and 42.57 — is followed by the July breakdown point (43.55). An eventual reversal atop this area would mark a step toward stabilization.
The pending retest from underneath will likely add color. (Also see the July 16 review.)
Meanwhile, the iShares MSCI Japan ETF has reached a potentially consequential technical test.
Specifically, the shares are pressing major support (67.00) closely matching the 200-day moving average, currently 67.14.
Tactically, the shares have registered just one close under the 200-day since August 2020 — (see the July 19 strong-volume downdraft) — and the downturn has been punctuated by an immediate reversal back atop the trending indicator.
Still, the late-July rally attempt registered as comparably flat, capped by the 50-day moving average, currently 68.10. An eventual close atop the 50-day would place the shares on firmer technical ground.
More broadly, the prevailing retest punctuates a prolonged five-month range, laying the groundwork for potentially material downside follow-through.
Combined, the tenuous China/Japan technical backdrop — if not outright bearish backdrop — presents at least the prospect of contagion elsewhere.
Moving to specific names, AutoNation, Inc. is a well positioned large-cap automotive retailer.
Earlier this month, the shares knifed to record highs, rising after the company reported strong second-quarter results, and increased its share buyback program.
The subsequent flag pattern has formed amid decreased volume, positioning the shares to build on the initial spike.
Tactically, the prevailing range bottom (114.35) is followed by the breakout point (108.00). A sustained posture higher signals a bullish bias.
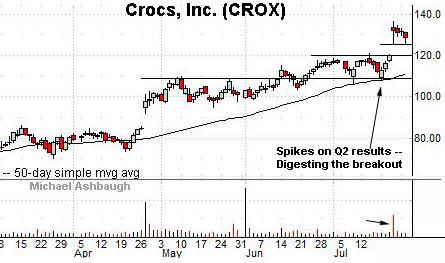
Finally, Crocs, Inc. is a well positioned large-cap manufacturer of footwear and related accessories.
As illustrated, the shares have recently gapped to all-time highs, rising after the company’s strong second-quarter results and upwardly revised outlook.
The subsequent pullback places the shares near gap support (125.25) and 6.1% under the July peak.
Delving deeper, the bottom of the gap (120.33) closely matches the breakout point (120.00). The prevailing rally attempt is intact barring a violation.
(On a granular note, the prevailing leg higher originates from the former breakout point, an area matching the 50-day moving average.)
Editor’s Note: The next review will be published Friday.


